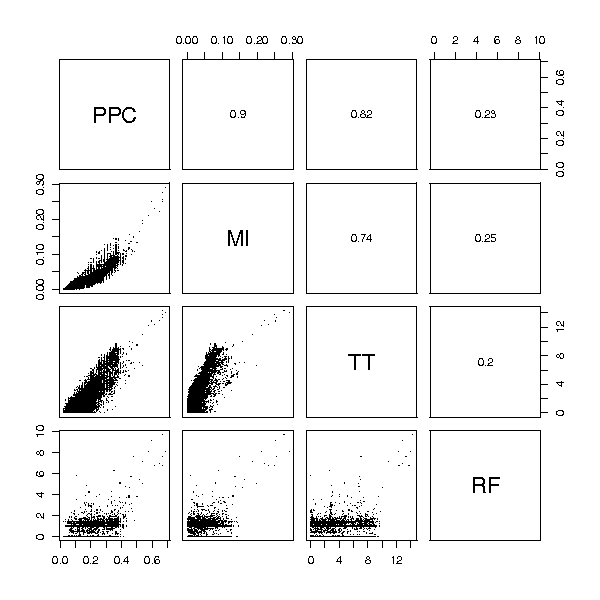
Figure 5.

Prostate cancer data ranking comparison. Rankings obtained from several feature selection methods for the Prostate cancer dataset. Each small panel shows the comparison of two rankings. A point with coordinates (i, j) corresponds to the feature with score i in one method and score j in the other (for all methods the most important features receive the highest scores). Values of the Spearman correlation coefficient for each pair of scoring functions are given in the panels above the diagonal. The random forest feature ranking (RF) is considerably different than the rest. Peak probability contrast method (PPC), mutual information (MI) and t-statistic (TT) share a common group of the highest scored features, but significant differences can be observed in ranks of less important features, which also provide valuable information for classification.
