
Figure 5. Relationship of percent ladder beam score (LBS) to performance on the “mouse” BBB.
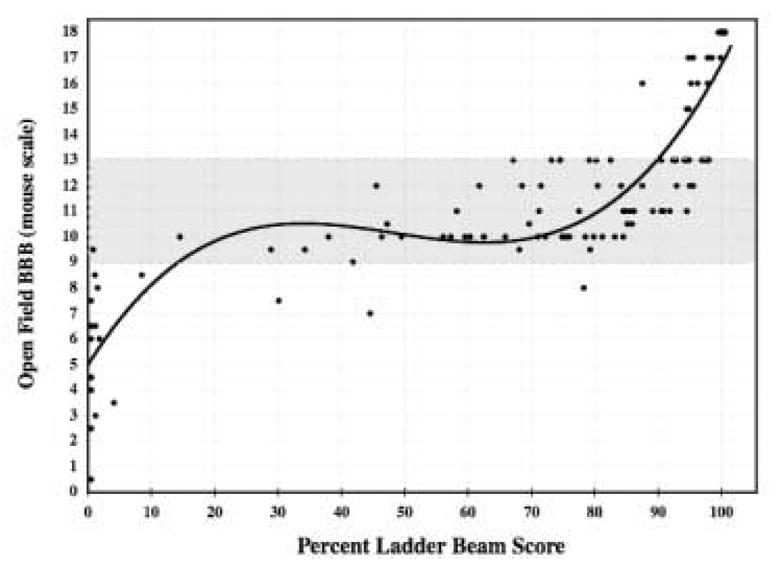
There is a third order polynomial relationship between performance on the BBB and ladder beam score measured within 1 week of each other. If BBB=y and LBS=x, then y=6E5x3 − 0.0089x2 + 0.3885x + 5.1825 (r2=0.8197, r=0.91). This graphical representation suggests that the LBS is optimal to separate animals within the 9 to 13 point range on the mouse modified BBB. The grey box corresponds to animals with weight-supported stance up to animals with frequent to consistent plantar stepping with frequent forelimb to hindlimb coordination.