
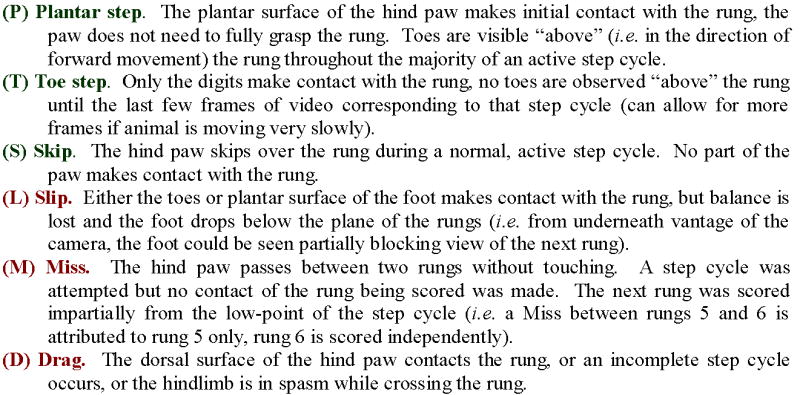
Table 2. Operational definitions for positive events (green) and negative events (red) observed in mice during horizontal ladder beam crossing.
Each rung is analyzed, frame-by-frame, and is assigned a letter to denote one of six possible categories in a spreadsheet. When in doubt, a given rung is scored to the deficit: the animal is given a negative score. This increases the possibility of detecting of improvement over time. A data entry spreadsheet automatically calculates the ladder beam score (LBS %) as the number of positive events/total number of events and the cumulative number of errors across three trials (CE).
|