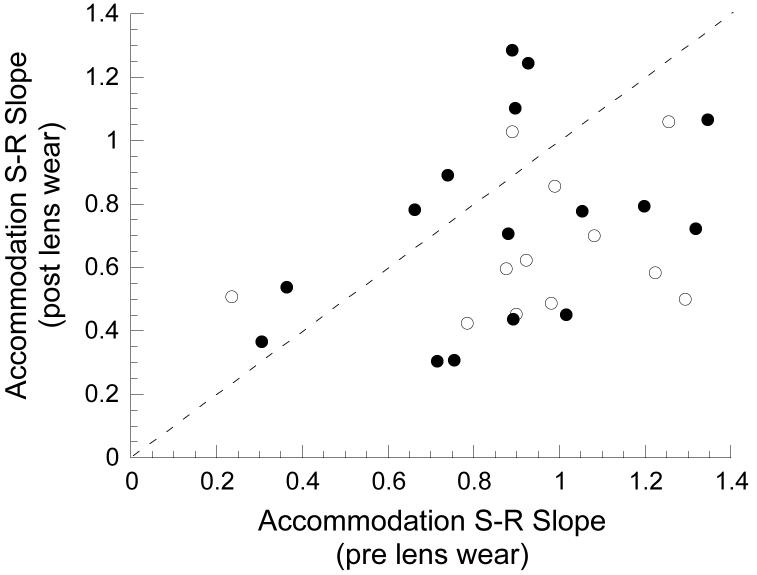
Figure 9.
Changes in individual accommodation S-R slope measured under monocular (white circles) and binocular (black circles) conditions are represented in this scatter plot of slopes measured before (x-axis) and after (y-axis) lens-induced changes in eye size and refractive state. The diagonal dashed line has a slope of 1. Points below the line indicate reduced slopes following lens wear. Points above the line indicate increasing slopes.

