
Figure 4.
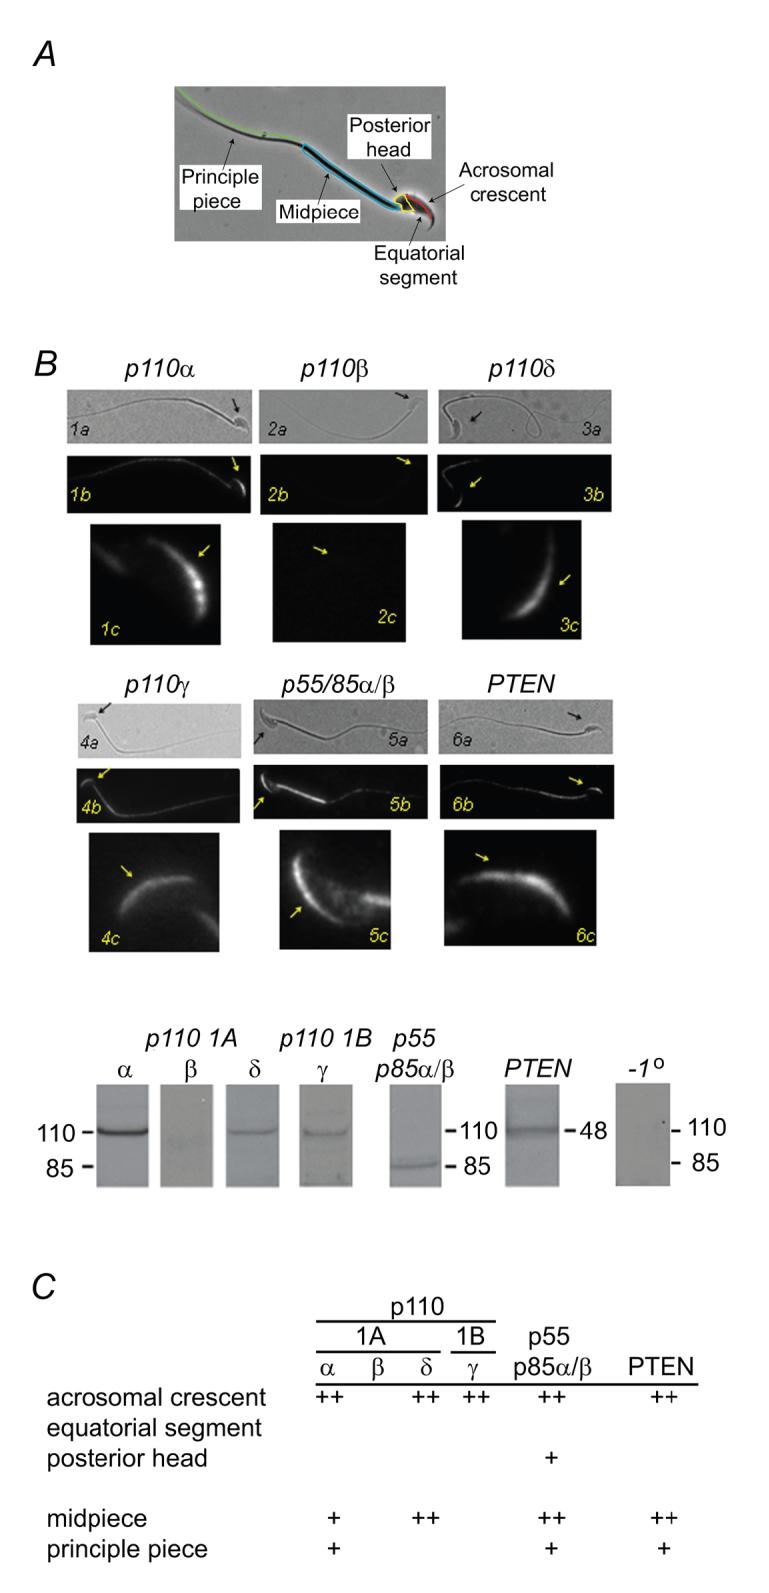
PI3 kinase and PTEN distribution in mouse sperm. (A) Surface domains of mouse sperm. (B, C) Immunolocalization of PI3 kinase catalytic and regulatory subunits and of PTEN. For each panel >100 sperm were examined. A typical labeling pattern is illustrated in (B) and results are summarized in (C). (B) Panel shows paired phase contrast and fluorescence images (a, b; scale bar, 10 μm) and an enlarged fluorescence image of the sperm head (c; scale bar, 5 μm). Arrows facilitate orientation. Immunoblots of PI3 kinase catalytic and regulatory subunits, of PTEN, and of a control (no primary antibody). (C) Summary of immunolocalization results. Class 1A (catalytic subunits: p110α, -δ; a regulatory subunit, p85α) and IB (catalytic subunit, p110γ) PI3 kinase isoforms are detected in sperm and specifically in the acrosomal crescent region, as is PTEN. A third class IA PI3 kinase catalytic subunit (p110β) was not detected. ++, strong labeling; +, weak labeling; blank, no labeling detected.