Figure 1.
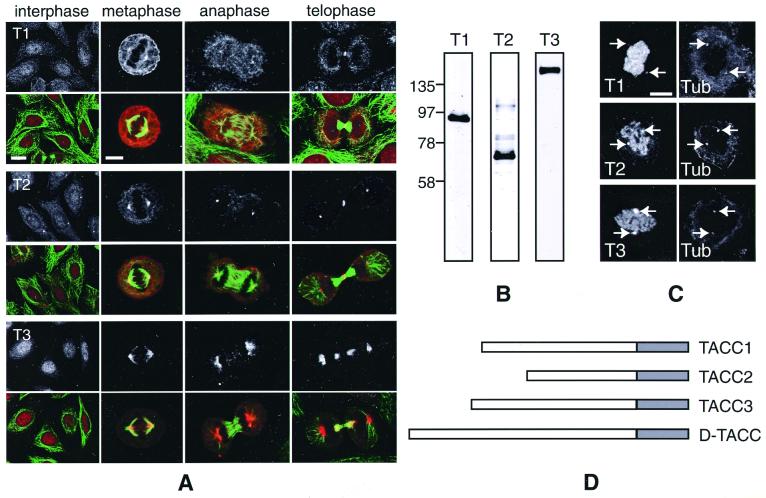
A comparison of the known human TACC proteins. (A) Fixed HeLa cells at interphase, metaphase, anaphase, and telophase were stained with anti-TACC antibodies (Top; red in color panels) and anti-tubulin antibodies (green in color panels). In this panel, and in all subsequent panels, T1 denotes TACC1, T2 denotes TACC2, and T3 denotes TACC3. Scale bars: interphase, 10 μm; mitotic cells, 5 μm. (B) Western blots of HeLa cell extracts probed with affinity-purified anti-TACC1 (lane 1), anti-TACC2 (lane 2), and anti-TACC3 (lane 3) antibodies. (C) Nocodazole-treated cells were stained with the anti-TACC antibodies (Left) and with a mixture of anti-α-tubulin and anti-γ-tubulin antibodies (Right) to monitor the location of the centrosomes and to confirm that microtubules were depolymerized. All of the TACC antibodies stained the centrosomes (arrows) even though there were no visible microtubules in the cell. Note that the chromosomes in these cells were counterstained with propidium iodide, and the signal from this fluorophore “bleeds through” into the channel used to detect the TACC antibodies. (Scale bar = 4 μm.) (D) A schematic diagram of the TACC proteins. The shaded boxes represent the conserved 200-aa TACC domain that is predicted to form a coiled-coil.

