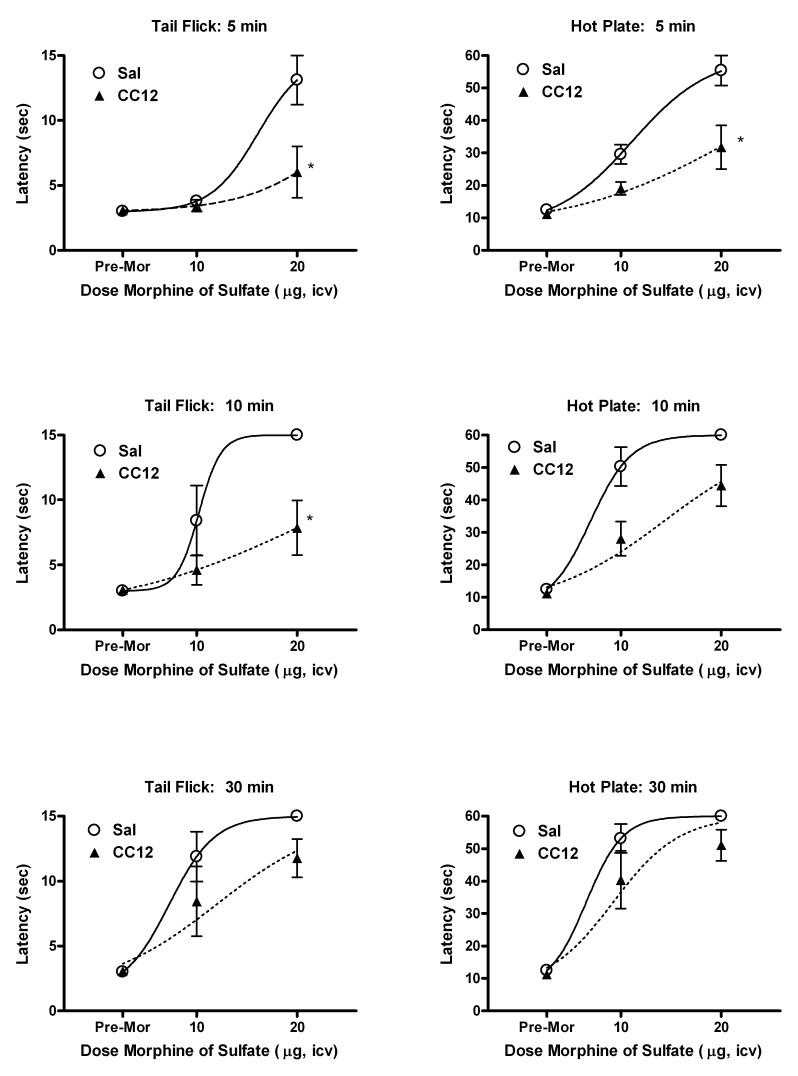
Figure 5.
Antagonism of MOR antinociception by icv CC12 in rats. Subjects were tested and injected twice as described in Fig. 3A. The first icv injection was either CC12 (500 nmol, triangles) or pH 4.5 saline vehicle (circles), followed by re-testing (“Pre-Mor”), followed by icv MOR sulfate (doses in μg shown on abscissa). Tail flick (left) and hot plate (right) latencies (ordinates, mean ± SEM for 5-8 subjects per group) are shown at 5 (top), 10 (middle) and 30 (bottom) min intervals following MOR treatment. *P < 0.05 vs. Sal at the same time and dose.

