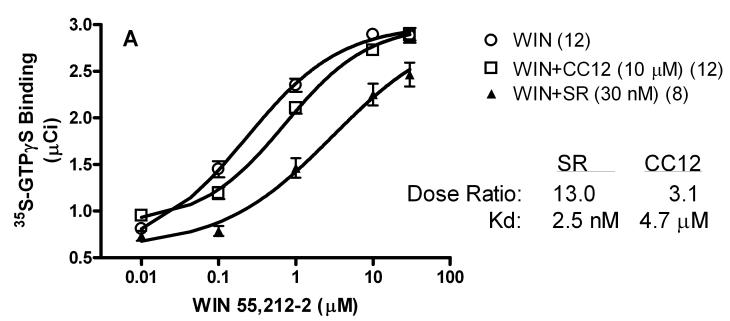
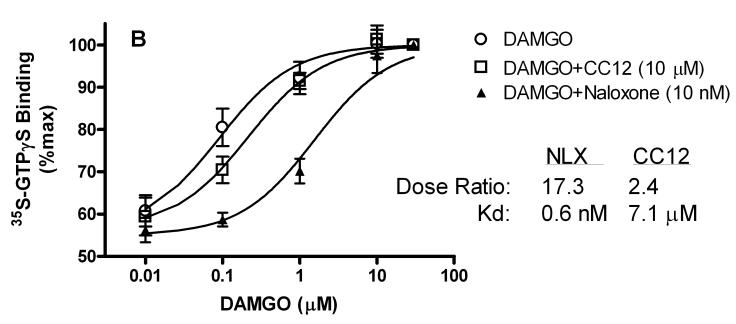
Figure 8.
CB1 receptor (A, top) and mu opioid receptor (B, bottom) activity of CC12. Frozen sections from globus pallidus (top) or thalamus (bottom) were incubated as described in the presence of 35S-GTPγS, candidate antagonists, and increasing concentrations of either the CB1 agonist WIN55,212-2 (WIN, top, abscissa), or the mu agonist DAMGO (bottom, abscissa). A) Specific binding of 35S-GTPγS (μCi, mean ± SEM) is shown for the number of brain sections given in parentheses. B) In the thalamic sections, binding was normalized to 30 μM responses for each dose-response curve (n=5-6). For each antagonist/receptor combination, the dose ratio (shifted EC50/control EC50) is given along with the calculated Kd values. SR141716A (SR) and naloxone (NLX) were used as reference antagonists.


