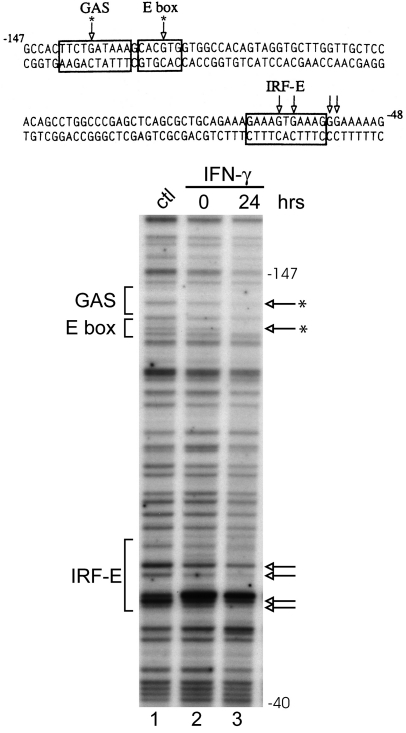
Fig. 8.
In vivo footprint of CIITA pIV in myeloma cells reveals protein-DNA contacts within the GAS, IRF-E and E box sites. The sequence of the promoter region is shown with boxes indicating the relevant cis-elements. Genomic footprints of the upper strand are shown in the lower panel. Lane 1 shows genomic DNA that was methylated in vitro to reveal the complete guanine ladder. Lanes 2 and 3 show the results of IFN-γ treatment using cells treated with DMS in culture. Open arrows indicate bases protected from modification. While a number of bases in the IRF-E site are protected both before and after treatment (indicated by arrows), central bases in the GAS and E box sites become protected after IFN-γ treatment (see asterisks). Similar results were seen for U266 cells (data not shown).

