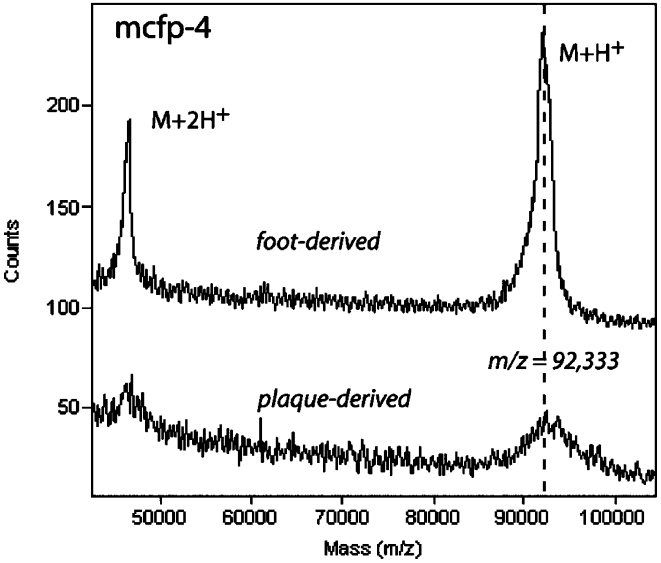
FIGURE 4.
MALDI-TOF mass spectrum of purified mcfp-4 from both mussel feet and plaques. Peaks from right to left were [M + H]+ and [M + 2H]2+. Delayed extraction (200 ns) in positive ion mode with an accelerating voltage of 25 000 V, a grid voltage at 93%, and a guide wire voltage at 0.1%. The spectrum represents an average of 256 scans.

