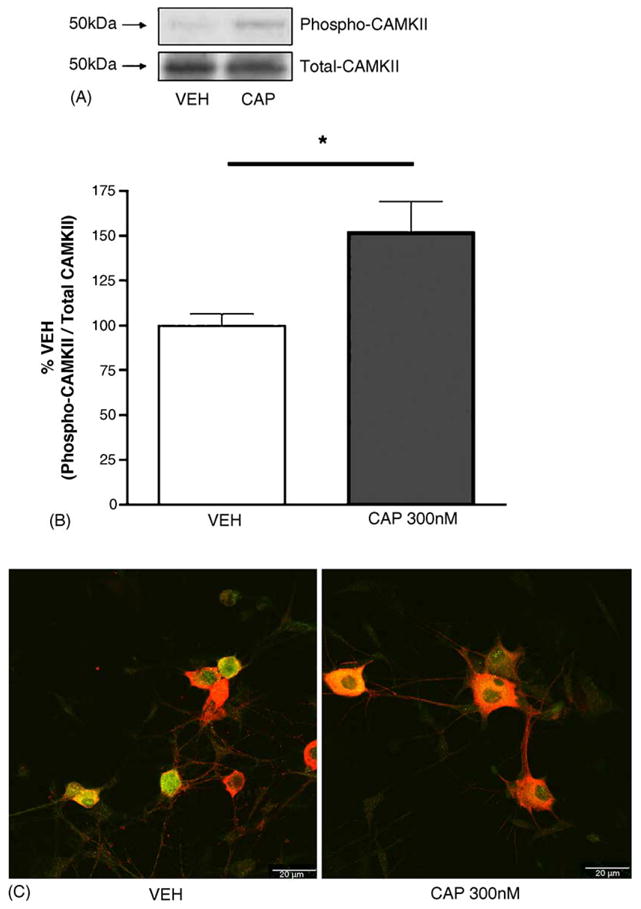
Fig. 2.

TG neurons were exposed to VEH or 300 nM CAP for 10 min, scraped into tubes on ice and prepared for protein analysis by SDS–PAGE. Panel A illustrates a representative Western blot for phopho-CaMKIIα (Thr286/287) and total CaMKIIα protein, which has been quantitated in panel B (*p < 0.05, Student’s t-test). Panel C: Confocal images show independent TG neuronal culture representative photomicrographs taken at 63× (scale bar = 20 μm) of phospho-CaMKIIα immunoreactivity (green) and TRPV1-immunoreactivity (red, colocalization in yellow) in TG neurons exposed to VEH or CAP for 10 min.
