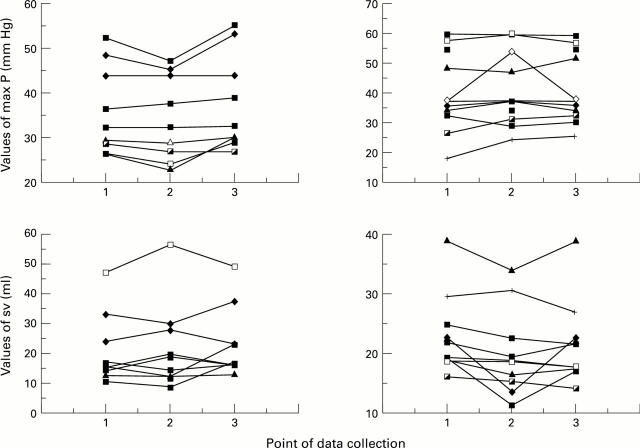
Figure 1 .
Values of maximum right ventricular pressure (maxP) and conductance derived stroke volume (sv) in subjects undergoing coronary angioplasty. Values are displayed before balloon inflation (1), after 60 seconds of inflation (2), and 60 seconds after balloon deflation (3). Data from right coronary artery inflations are shown on the left and from left anterior descending coronary artery inflations on the right.

