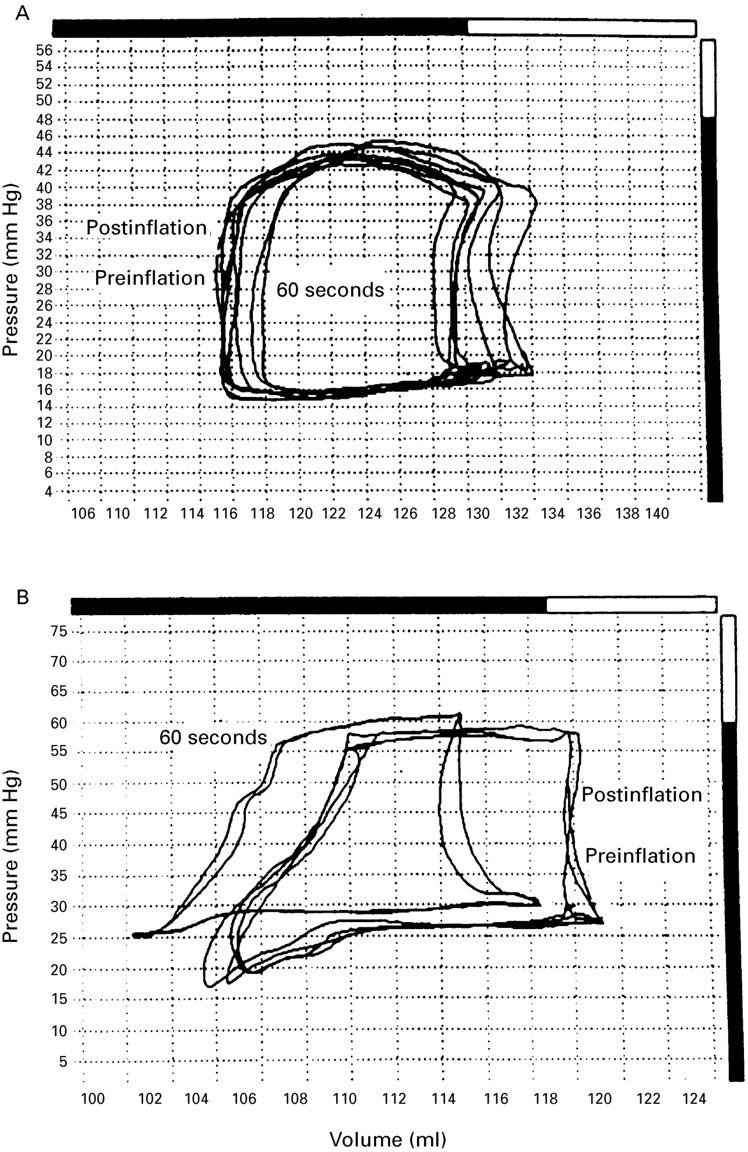
Figure 3 .

Right ventricular pressure-volume cycles from patients undergoing coronary angioplasty to lesions in the right coronary artery (above) and left anterior descending coronary artery (below). Two characteristic patterns of change in the diastolic pressure-volume relations are contrasted. The cycles in the top figure follow a continuous relation, and those in the bottom figure are displaced vertically during coronary artery occlusion.
