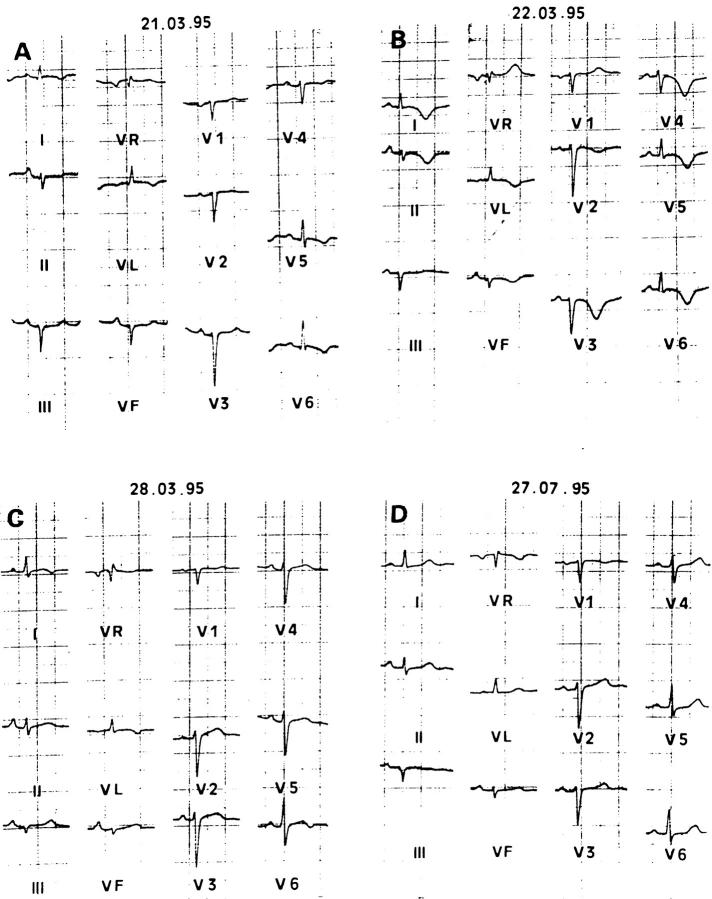
Figure 2 .
Electrocardiograms recorded in patient 2 at admission (A), one day (B) and seven days (C) after admission, and after four months of follow up (D). Similar abnormalities and evolution as in figure 1 are seen with as well as left axis deviation. Pseudoischaemic repolarisation abnormalities are near normal at the end of the first week (C). (D) ECG is normal apart from a less important left axis deviation.

