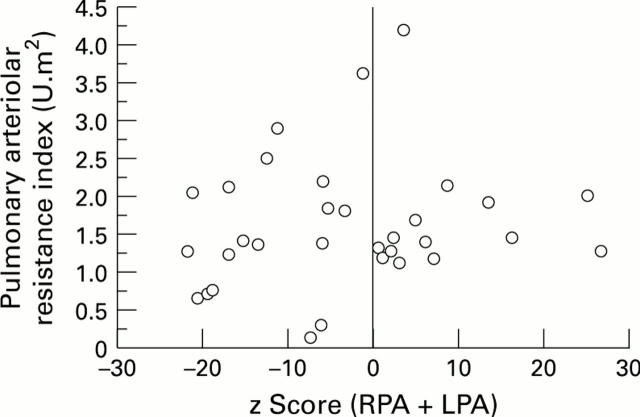
Figure 3 .
Diagram showing the pulmonary arteriolar resistance index (PARI) at the time of follow up in relation to pulmonary artery (PA) diameters (expressed as z score right PA + z score left PA). There was no significant difference between patients with larger pulmonary arteries (z score right PA + z score left PA > 0) and smaller pulmonary arteries (z score right PA + z score left PA < 0).

