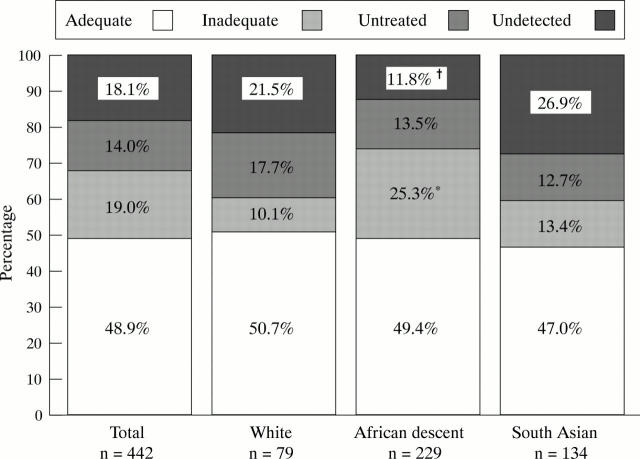
Figure 3 .
Levels of detection, management, and control of hypertension in the community as a whole (total) and in each ethnic group separately. The numbers indicate the proportion (%) of participants with hypertension (blood pressure ⩾ 160 and/or 95 mm Hg or on drug treatment) (1) who were on treatment and whose blood pressure was below 160 and/or 95 mm Hg (adequate); (2) who were on treatment and whose blood pressure was ⩾ 160 and/or 95 mm Hg (inadequate); (3) who were known hypertensives and on no drug treatment (untreated); (4) who had never been told they had hypertension before the screening (undetected). *p < 0.002, †p = 0.001 by χ2 statistics when comparing the three ethnic groups.

