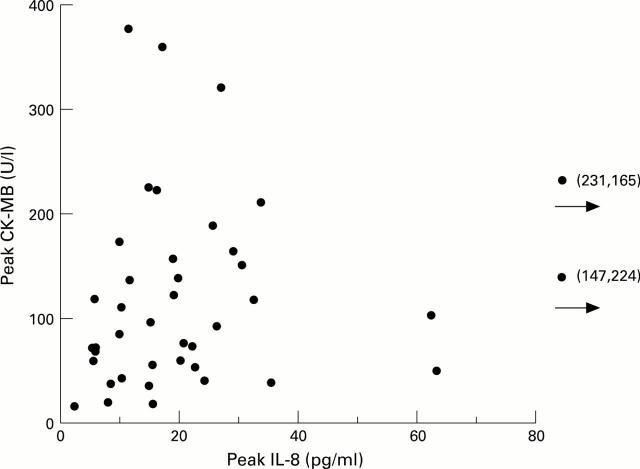
Figure 1 .
Scattergraph showing peak IL-8 concentrations in plasma on the X axis and peak creatine kinase MB isoenzyme (CK-MB) on the Y axis, showing the lack of correlation. Each point on the graph represents the value in one patient. Two outliers are shown on the right side of the graph with their respective CK-MB and IL-8 values. Neither erythrocyte bound IL-8 nor the sum of plasma and erythrocyte bound IL-8 was correlated with infarct size, as estimated from the peak CK-MB value (data not shown).

