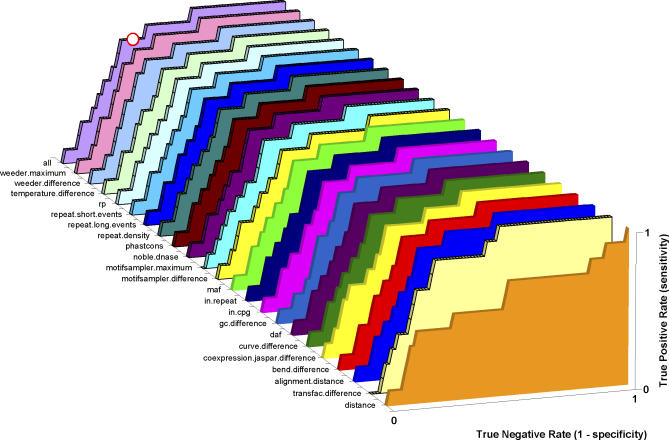
Figure 2. ROC Curves for Discriminating Known rSNPs from ufSNPs.
Representative ROC curves were calculated by training an SVM on a 90% subset of the 104-rSNP and ufSNP datasets. Here, 93 rSNPs and 882 ufSNPs were used for training, followed by testing on the held-out 10%. The ALL SVM approach was used for training. Furthermore, each curve had one tested property held out to demonstrate the impact of various properties on training. Notably, many curves are the same except for a marked reduction in performance when the “Distance to TSS” property is held out. The area under the “all” curve is 0.830. The dot on the “all” curve marks the location of the decision boundary selected by the SVM. At this boundary, the SVM identifies nine of 11 true positives and 56 of 69 true negatives. (Plots for each tested partition are available at http://www.bcgsc.ca/chum/gistplots.html).

