
Figure 2.
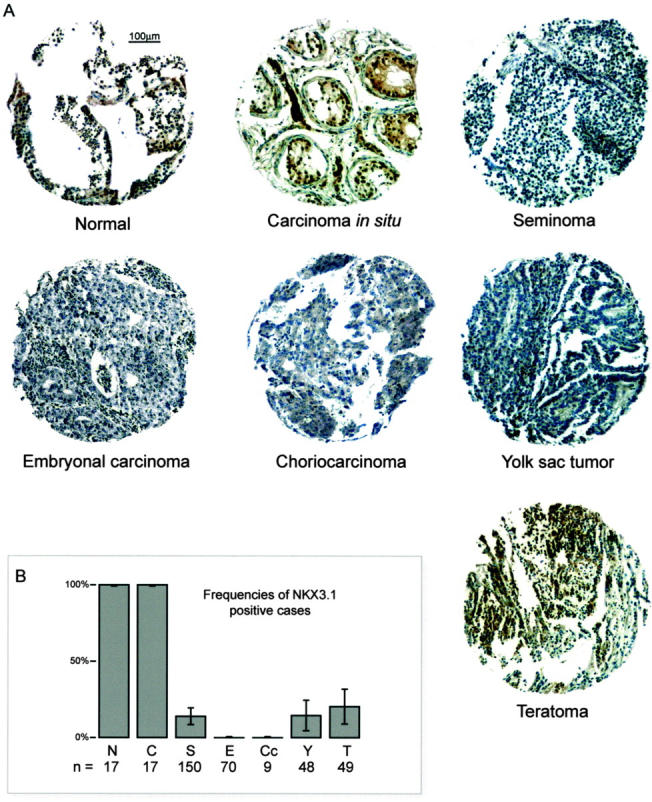
NKX3.1 expression analysis on a testicular germ cell tumor tissue microarray. A: One tissue core with representative staining is shown for each of the histological subtypes. Positive cases include the normal germ cells, carcinoma in situ, and the teratoma. The remaining cases were scored negative. B: The histogram bars represent the frequencies of NKX3.1 immunopositive cases for the subgroups of normal germ cells (N), carcinoma in situ (C), and the various histological subtypes of testicular germ cell tumor (S, seminoma; E, embryonal carcinoma; Cc, choriocarcinoma; Y, yolk sac tumor; T, teratoma). Error bars define 95% confidence intervals.