
Figure 3.
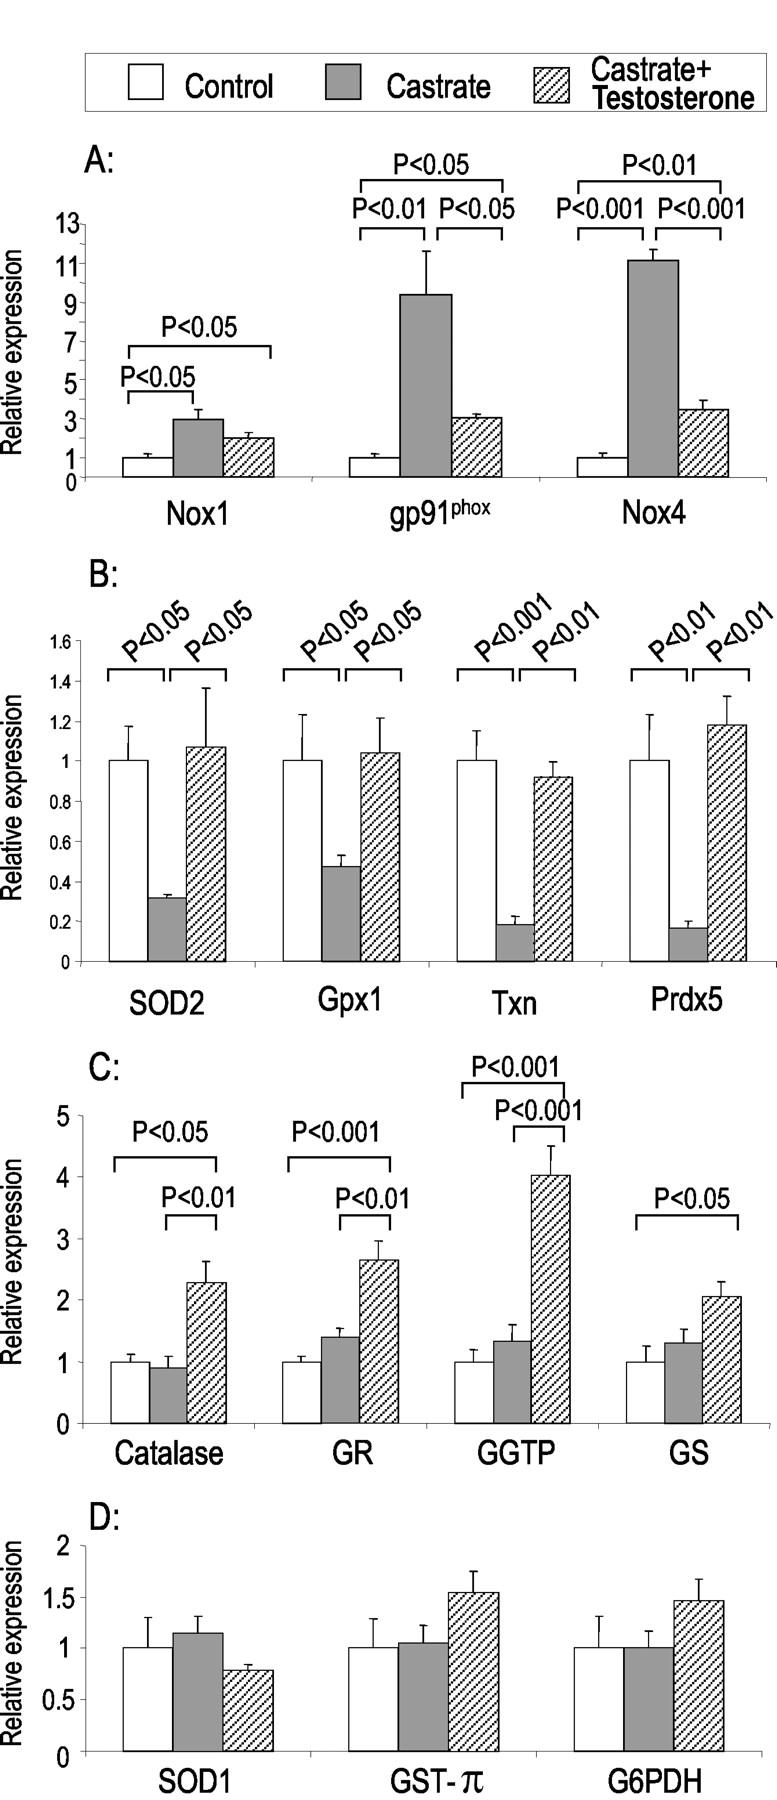
Quantitative real-time PCR analyses of mRNA abundance of major ROS-generating and ROS-detoxification enzymes and selected ROS scavengers in the VPs of control, castrated, and testosterone-replaced castrated animals. A: Genes demonstrating elevated mRNA levels in the VPs of castrated rats followed by partial reduction in transcript levels in VPs of testosterone-treated rats. A includes Nox1, gp91phox, and Nox4. B: Genes showing diminished mRNA levels in VPs of castrated animal versus control and testosterone replacement group. B includes SOD2, Gpx1, Txn, and Prdx5. C: Genes demonstrating no changes in mRNA levels in rat VP after castration but elevated levels after testosterone replacement. C includes catalase, GR, GGTP, and GS. D includes genes showing no changes in mRNA levels in VPs after castration or after subsequent testosterone replacement. D includes SOD1, GST-π, and G6PDH. Levels of expression in control animals were set to 1. Each column represents the average value from five animals and error bars represent SEM.