
Figure 9.
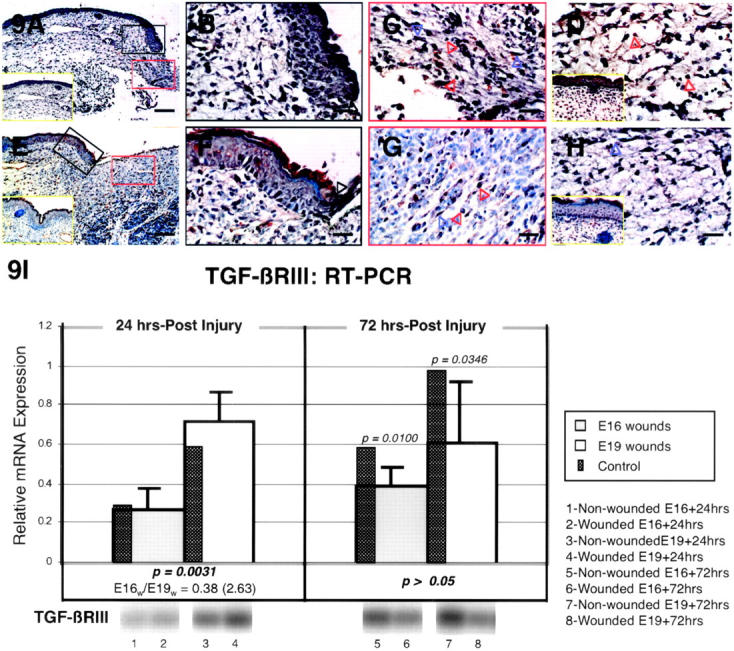
TGF-βRIII immunostaining of wounded E16 and E19 rat skin. A: E16 skin, 24 hours post-injury; magnification, ×100. Dermal TGF-βRIII expression is up-regulated while epidermal expression remain unchanged from non-wounded E17 skin levels [ie, E16 + 24 hours] (inset, A, yellow rectangle). B: E16 skin, 24 hours post-injury; magnification, ×400. Higher magnification view of wounded epidermis demonstrating minimal TGF-βRIII staining in outer, basal, and migrating (black open arrow) epidermal layers. C: E16 skin, 24 hours post-injury; magnification, ×400. Moderate TGF-βRIII staining is observed in dermal fibroblasts (blue open arrows) as well as in the ECM, while minimal staining is demonstrated in inflammatory cells (red open arrows). D: E16 skin, 36 hours post-injury; magnification, ×400. The moderate degree of TGF-βRIII up-regulation in dermal fibroblasts and ECM is not significantly different from non-wounded skin levels, although inflammatory cell (open red arrows) TGF-βRIII expression is increased relative to control E17.5 skin [ie, E16 + 36 hours] (inset, D, yellow rectangle). E: E19 skin, 24 hours post-injury; magnification, ×100. There is no significant difference in TGF-βRIII localization between injured and non-injured control skin. Non-wounded E20 [ie, E19 + 24 hours] control skin is also shown (inset, E, yellow rectangle). F: E19 skin, 24 hours post-injury; magnification, ×400. Similar to control skin, minimal epidermal staining is observed in the migrating (black open arrow) as well as in the outer and basal epidermal layers. G: E19 skin, 24 hours post-injury; magnification, ×400. Inflammatory cells (red open arrows) and dermal ECM for both wounded and non-wounded skin show minimal TGF-βRIII staining whereas fibroblasts (blue open arrow) demonstrate no staining. H: E19 skin, 36 hours post-injury; magnification, ×400. Dermal TGF-βRIII expression does not differ significantly from E20.5 [ie, E19 + 36 hours] control skin (inset, H, yellow rectangle). Bars: A and E, 200 μm; B–D, F–H, 50 μm. I: RT-PCR of TGF-βRIII. Please refer to the Figure 4Ic ▶ legend for an explanation of the bar graphs and representative Southern blot data.