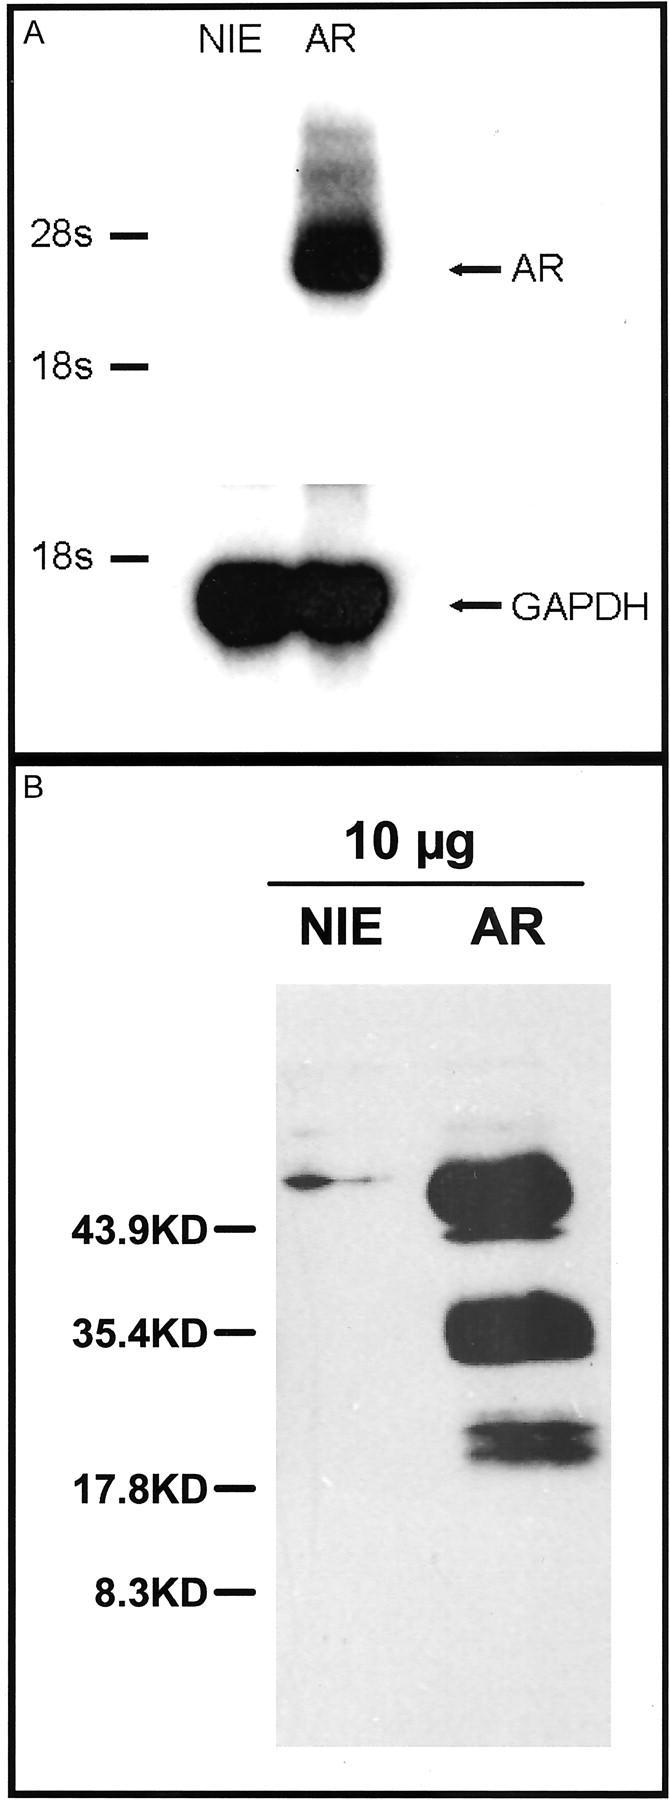
Figure 2.

Molecular analysis of HaCaT-AR cells. A: Northern blot detected AR mRNA only in the HaCaT-AR cells (right). B: Western blots detected a small amount of AR in the control cells (left). The AR overexpressing cells had much higher amounts of AR with different forms ranging from approximately 18 to 70 kd.
