
Figure 1.
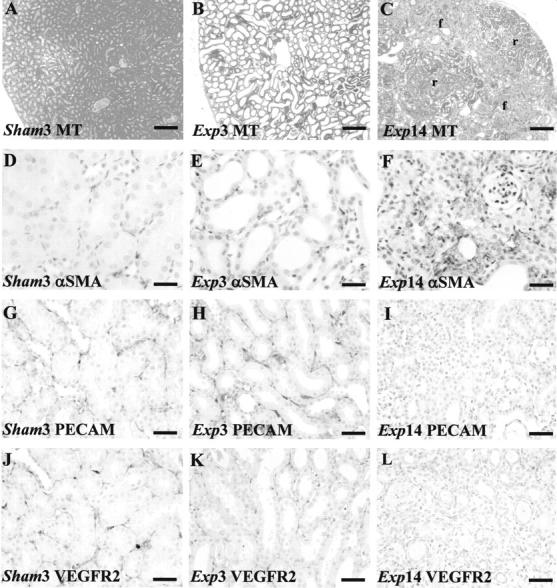
Effects of FA on gross morphology and endothelial markers. Typical views are shown from eight kidneys in each group. A to C and M to O were stained with Masson’s trichrome; D to L were stained with hematoxylin; D to F were immunostained for α-SMA; G to I and P to S were immunostained for PECAM; J to L were immunostained for VEGFR2. A: Sham group day 3 (sham3). B: Widespread flattening of cortical tubule epithelia in the experimental group on day 3 (Exp3). C: On day 14, the cortex of experimental group (Exp14) showed regenerated (r) and fibrotic (f) areas. D: In a typical high-power field, barely any peritubular cells immunostained for α-SMA in sham kidneys. E: On experimental day 3, several cells between tubules express α-SMA. F: On experimental day 14, α-SMA immunostaining was marked in fibrotic areas. G: Cortical peritubular capillaries immunostained for PECAM in sham kidneys. H: On experimental day 3, PECAM immunoreactive vessels were noted between acutely damaged cortical tubules. I: On experimental day 14, PECAM immunostaining was attenuated in fibrotic areas. J: Cortical peritubular capillaries immunostained for VEGFR2 in sham kidneys. K: On experimental day 3, VEGFR2 immunoreactive vessels were also noted between acutely damaged cortical tubules. L: On experimental day 14, VEGFR2 immunostaining was attenuated in fibrotic areas. M to O: Dotted lines indicate outer border of cortex. These frames show the blue/fibrotic color generated by Masson’s trichrome processed into black; note the extensive, patchy, fibrosis on experimental day 14 (O) versus the control (M) and experimental day 3 groups. P to S: These frames show the brown/capillary color from PECAM immunohistochemistry processed into black; note preservation of capillaries on experimental day 3 (Q) versus control (P); on experimental day 14, regenerated cortical zones show a modest reduction in signal (R), whereas virtually no signal was detected in fibrotic areas (S). T: Note increased cortical fibrosis area at experimental day 14. U: Note the modest fall in capillary area at experimental day 14 in regenerated locations (Exp14-R), and the major decrease of capillary area in fibrotic locations (Exp14-F). In T and U an asterisk indicates P < 0.05 versus control. Scale bars: 320 μm (A–C, M–O); 80 μm (D–L, P–S).