
Figure 2.
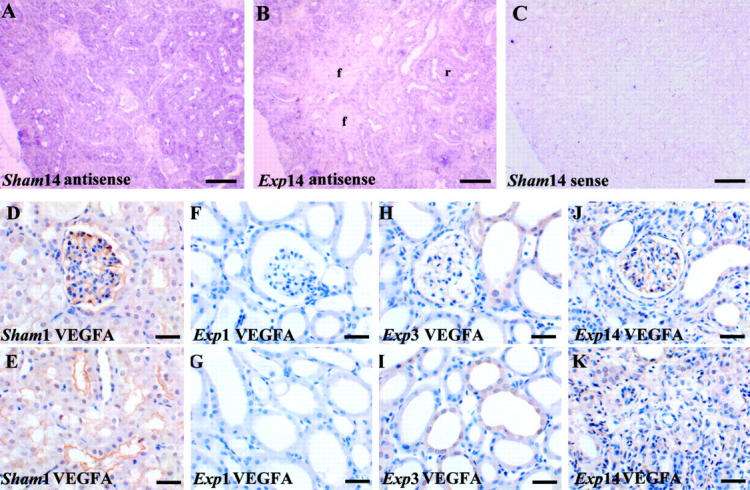
VEGF-A expression in tissue sections. Typical views are shown from eight kidneys in each group. A to C are VEGF-A in situ hybridizations, with A and B using an anti-sense probe and C using a sense probe; a positive signal is indicated by a purple/blue color; D to K were stained with hematoxylin; D to K were immunostained (brown) for VEGF-A. A: In a day 14 sham sample VEGF-A transcripts were detected mainly in tubule epithelia. B: In a day 14 experimental sample VEGF-A transcripts appeared decreased especially in fibrotic areas (f). C: Sense control in a sham kidney shows minimal background color. D and E: VEGF-A immunostaining cells in the periphery of the glomerular tuft (D) and in some cortical tubules (E) of a sham kidney. F and G: On experimental day 1 VEGF-A immunostaining was not detected in glomeruli (F) and cortical tubules (G). H and I: On experimental day 3 faint VEGF-A immunostaining was detected in some glomeruli (F) and dilated cortical tubules (G). J and K: In fibrotic areas, on experimental day 14, faint VEGF-A immunostaining could be detected in glomeruli (J) but was absent in atrophied tubules and surrounding fibrotic areas (K). Scale bars: 160 μm (A–C); 40 μm (D–K).