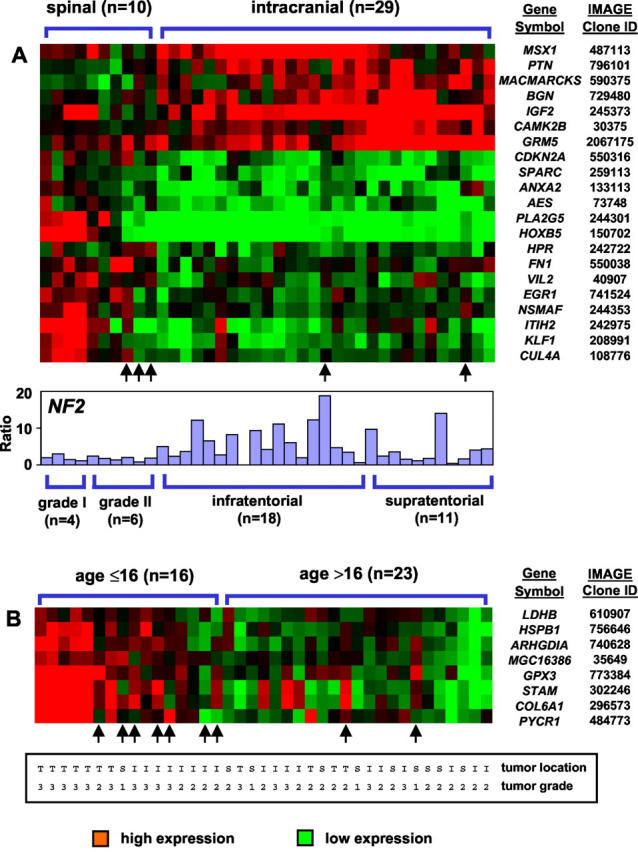
Figure 1.

Supervised hierarchical clustering analysis of differentially expressed genes according to tumor location (A, spinal versus intracranial) and patient age (B, ≤16 years versus >16 years). The genes were selected by the nearest shrunken centroid classification that identifies minimal combinations of genes that provide best discrimination between two known patient groups. For illustration, each gene was normalized to the mean expression between both patient groups. Misclassified patients are indicated by arrows. In addition, the NF2 gene expression of each individual patient is shown by bar plots (A). T, supratentorial; I, infratentorial; S, spinal.
