
Figure 4.
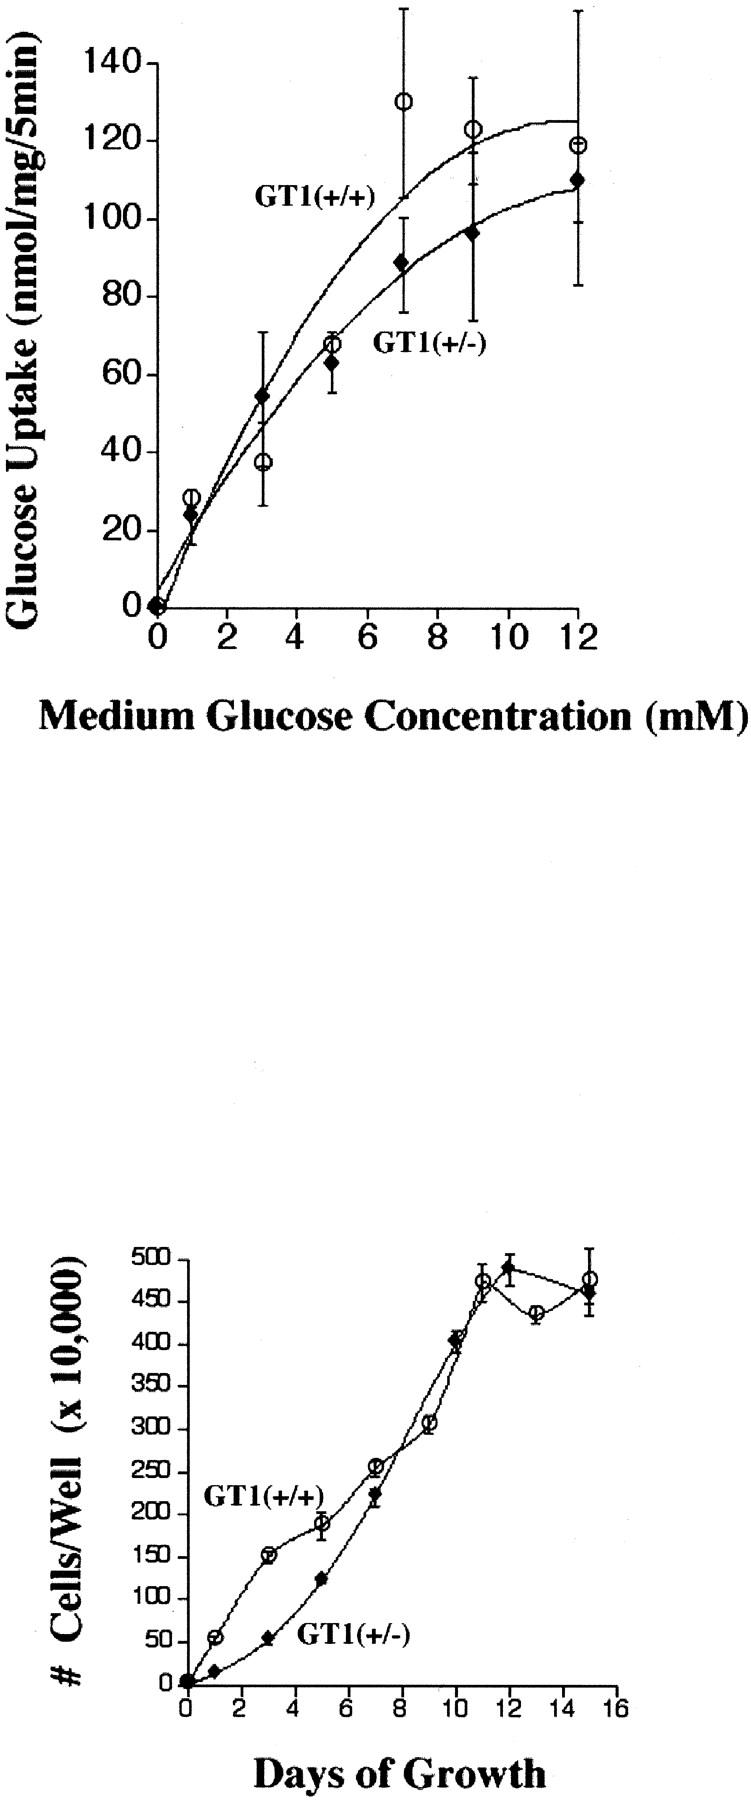
Top: The 5-minute 3H2-DOG uptake rates are shown for extracellular glucose concentrations ranging from 0 to 12 mmol/L. Although there was a tendency for lower glucose uptake in GT1(+/−) ES cells, the difference in the initial 5-minute glucose uptake rates using trace quantities of 3H2-DOG was not statistically significant (P < 0.2, see text). Bottom: Growth of GT1(+/+) and GT1(+/−) ES cells throughout 15 days in culture. The growth curves of the two cell types were similar except at the early time points (days 1 to 5) when initial growth of the GT1(+/−) ES cells appeared to be mildly delayed.