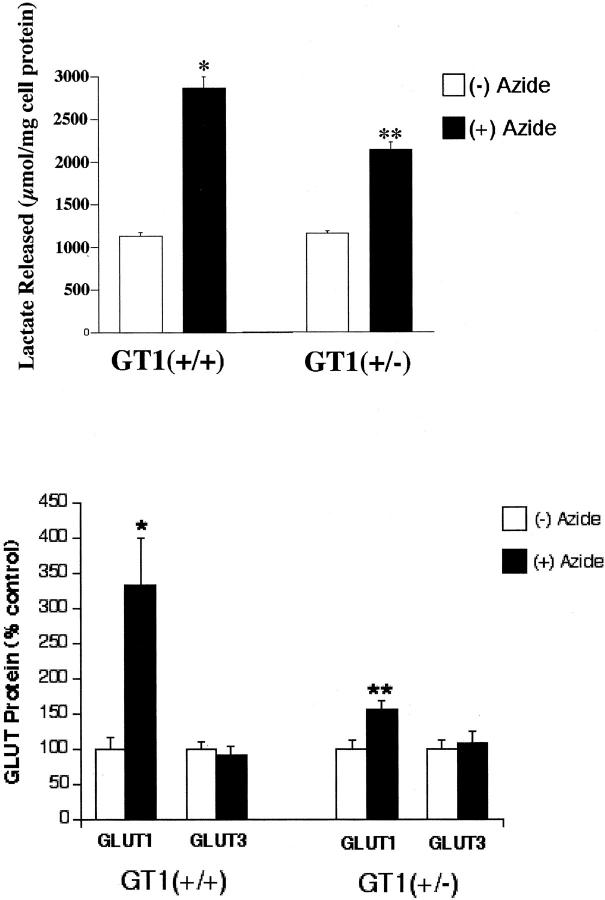
Figure 5.
Top: Graph of lactate release from GT1(+/+) and GT1(+/−) ES cells with and without 12 hours of 5 mmol/L sodium azide treatment to inhibit oxidative phosphorylation. *, P < 0.002 versus lactate release by GT1(+/+) cells without sodium azide treatment. **, P < 0.002 versus lactate release by GT1(+/−) cells without sodium azide treatment. Bottom: Graph of GLUT protein levels in GT1(+/+) and GT1(+/−) ES cells, in response to 12 hours of 5 mmol/L of sodium azide treatment (closed bar) to inhibit oxidative phosphorylation. GLUT1 protein was significantly increased by azide in both the GT1(+/+) cells [*, P < 0.02 versus (−) azide control] and the GT1(+/−) cells [**, P < 0.02 versus (−) azide control] (n = 10 in each group). However, the increase of GLUT1 protein in GT1(+/−) cells was substantially less. GLUT3 protein levels were unchanged with sodium azide treatment in both cell types, P > 0.1 for azide versus control in both GT1(+/+) and GT1(+/−) ES cells, n = 7 in each group. GLUT protein levels are shown as percent, where the (−) azide control for each group (open bar) is set at 100%.

