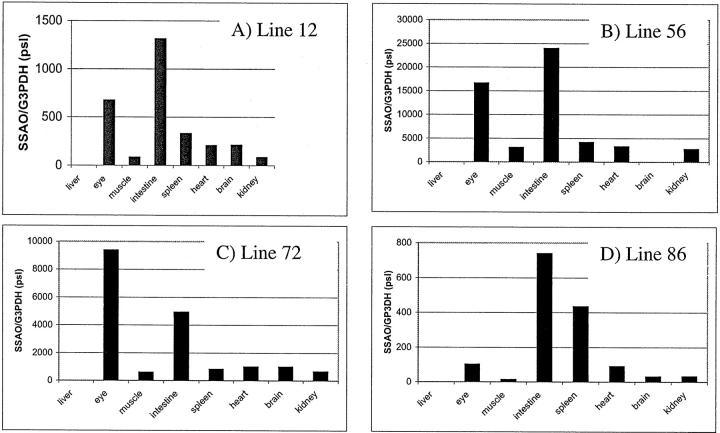
Figure 3.
Tissue distribution of transgenic SSAO RNA. Total RNA from a panel of organs from 2-month-old transgenic and control mice was analyzed by Northern blot analysis. The ratio (arbitrary pixel units) of SSAO RNA to G3PDH, a housekeeping gene, is depicted for line 12 (A), line 56 (B), line 72 (C), and line 86 (D).

