
Figure 3.
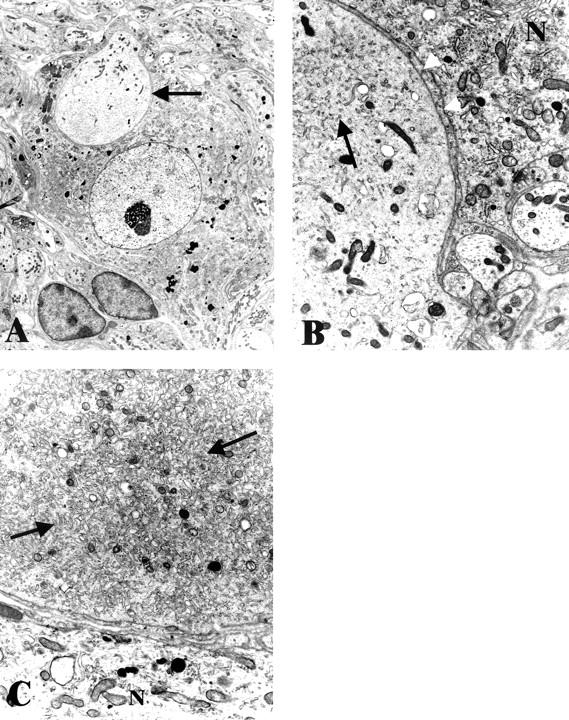
Neuritic dystrophy in the STZ-diabetic mouse is characterized by the same neuropathology as the diabetic NOD mouse, although at a significantly decreased frequency. A dystrophic neurite (arrow, A) at higher magnification (arrow, B) shows scattered tubulovesicular elements as well as an intervening satellite cell process (arrowheads, B). A more substantial accumulation of tubulovesicular elements is seen in other dystrophic neurites (arrows, C). B and C: N = neuronal cell body. Original magnifications: ×3250 (A); ×15,600 (B); ×9750 (C).