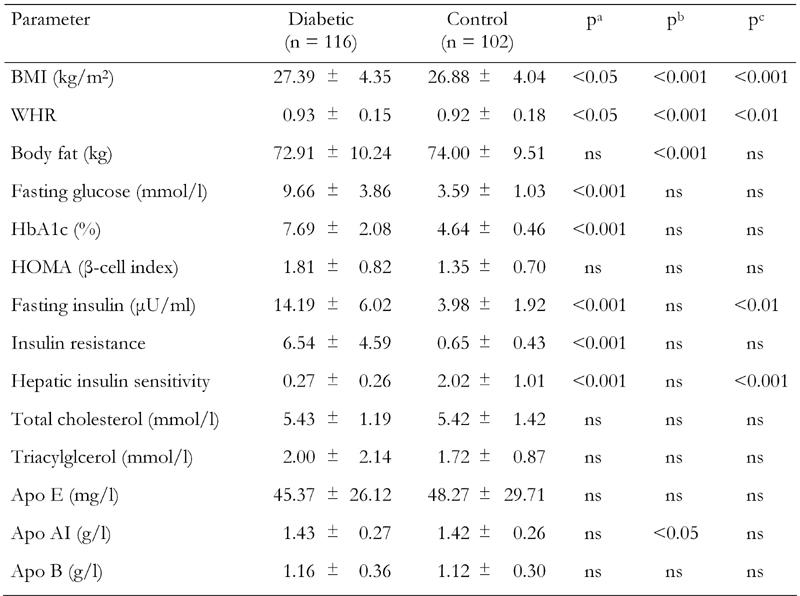
Table 2. Clinical and biochemical characteristics of type 2 diabetic patients and control subjects.

Values represent mean ± SD. ns: not significant. p values are corrected for multiple comparisons (Bonferroni). a: control vs. diabetes. b: resistin genotype effect (GA + AA vs. GG). c: difference of resistin genotypes between diabetic and control groups. WHR: waist-to-hip ratio. HOMA: homeostasis model assessment (= 20 × fasting insulin / (fasting plasma glucose - 3.5)). Apo: Apolipoprotein. Insulin resistance = fasting serum insulin (in μU/ml) × fasting plasma glucose (in mmol/l) / 22.5. Hepatic insulin sensitivity = k / fasting insulin × fasting plasma glucose (where k = 22.5 × 18 = 405).
