
Figure 1. Glycemic Responses in Wild-Type versus KLF15-Deficient Mice.
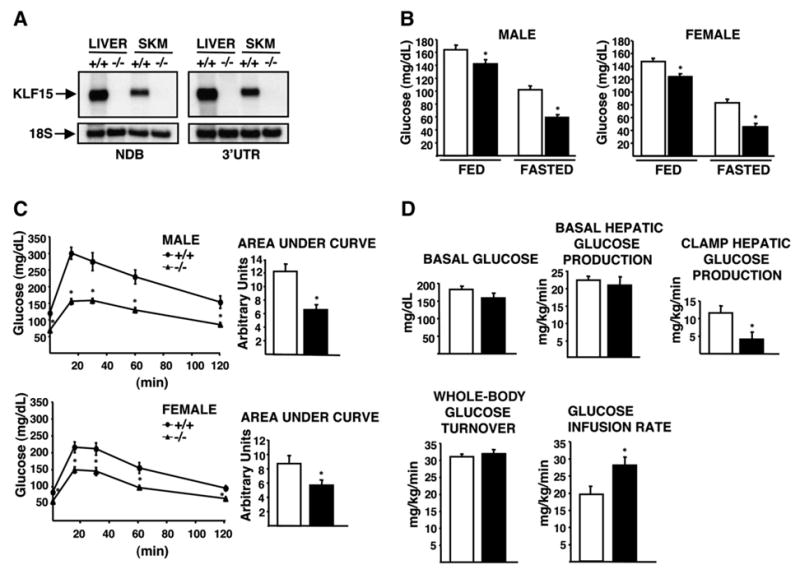
White bars = wild-type; black bars = KLF15−/−. Mice are 2.5–3.5 months old unless otherwise stated.
(A) Representative northern analysis of KLF15 expression in WT (+/+) and KLF15 null (−/−) tissues using probes against the non-DNA-binding domain (NDB) and 3′ untranslated region (3′UTR) of KLF15. Ten micrograms of total RNA was loaded per lane.
(B) Blood glucose levels of WT and KLF15−/− mice in the ad libitum-fed or 18 hr-fasted states; n = 15–20 mice per group. In this and all other figures, error bars represent ± SEM.
(C) Blood glucose concentrations during a glucose tolerance test. Mice were fasted for 16 hr and received an intraperitoneal (i.p.) injection of 1 g glucose/kg body weight. Tail-vein blood samples were assessed for glucose concentration immediately before injection (time 0) and at 15, 30, 60, and 120 min postinjection; n = 7–11 mice per group.
(D) Hyperinsulinemic-euglycemic clamp study in WT and KLF15−/− 4-month-old male mice. Top left: basal plasma glucose levels after a 5 hr fast. Top middle: basal hepatic glucose production after a 5 hr fast. Top right: hepatic glucose production during insulin clamp. Bottom left: insulin-stimulated whole-body glucose turnover. Bottom right: glucose infusion rate during insulin clamp. n = 7 mice per group. Statistical comparisons were made by repeated-measures ANOVA (C) and Student’s t test for unpaired samples (B–D). *p ≤ 0.05 compared to WT control.