
Figure 3.
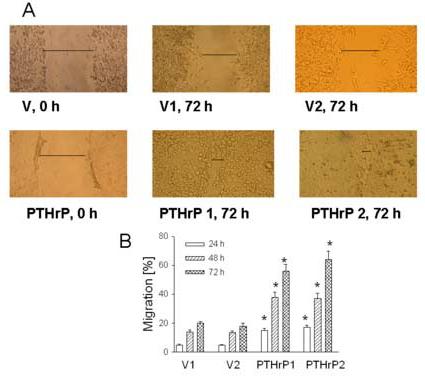
Cell migration of PTHrP-overexpressing vs. control LoVo cells Migration was analyzed using a monolayer scratch assay, performed as described in Materials and Methods. (A) Images at 0 and 72 h after scratch are shown. PTHrP 1 and 2 represent two independent PTHrP-overexpressing clones; V1 and 2 represent two independent empty vector transfectants (control). The horizontal line marks the edges of the monolayer. Magnification, x10. (B) Quantitation of cell migration 24 h, 48 h, and 72 h after wounding the cell monolayer. Each bar is the mean ± SEM of two independent experiments for each of four individual PTHrP-overexpressing and two independent empty vector-transfected clones. * = Significantly different from the control value (P < 0.001).