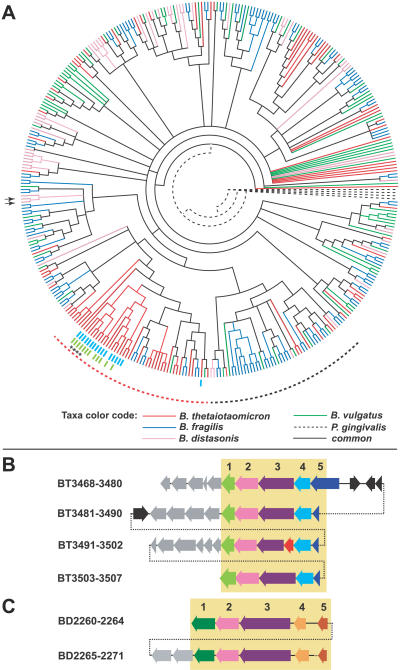
Figure 5. Cladogram Comparison of SusC/SusD Pairs Shows Both Specialized and Shared Branches among the Bacteroidetes.
(A) Cladogram generated from all fully sequenced Bacteroidetes. Branches that are unique to each species are color-coded as indicated. The homologous RagA/RagB proteins from P. gingivalis were selected as an arbitrary root (dashed branches). Dashed lines surrounding the tree indicate (1) a clade that is dominated by B. thetaiotaomicron SusC/SusD pairs (39/45 pairs, red dashes) and (2) a clade that is poorly represented in B. thetaiotaomicron (7/34 pairs, black dashes). Colored hash marks surrounding the cladogram represent the linkage of two other protein families, which show syntenic organization within related B. thetaiotaomicron SusC/SusD-containing loci: NHL repeat–containing proteins (light blue) and a group of conserved hypothetical lipidated proteins (light green). These protein families are not represented in the other sequenced Bacteroidetes, occur only adjacent to SusC/SusD pairs, and have no predicted functions. See http://rd.plos.org/pbio.0050156.a for locus tags for each taxon, branch bootstrap values, and lists of SusC/SusD-linked genes.
(B) An example of a recently amplified polysaccharide utilization locus in which the synteny of three flanking SusC/SusD genes has been maintained. The locations of the four SusC/SusD pairs encoded within these amplified clusters are indicated on the cladogram shown in (A) by asterisks (*). The locus schematic is arranged so that groups of related proteins (mutual best BLAST hits) are aligned vertically within the yellow box. The functions of amplified genes are indicated by numbers over each vertical column and, where applicable, are color coded to correspond to (A): 1, conserved hypothetical lipidated protein; 2, SusD paralog; 3, SusC paralog, 4, NHLrepeat–containing protein; and 5, glutaminase A (note that in three clusters, this gene has been partially deleted). Gray-colored genes downstream of each amplified cluster encode hypothetical proteins or predicted enzymatic activities (e.g., dehydrogenase, sulfatase, and glycoside hydrolase) that are unique to each cluster. A xenolog that has been inserted in one gene cluster is indicated in red; other genes are black. Dashed lines connecting gene clusters show linkage only, and do not correspond to actual genomic distance.
(C) An example of a recently duplicated locus from B. distasonis that includes duplicated regulatory genes. Syntenic regions are aligned as in (B) and include a single sulfatase (1, dark green), a SusD paralog (2, light purple), SusC paralog (3, dark purple), an anti-σ factor (4, light orange), and an ECF-σ factor (5, dark orange). Two other downstream sulfatase genes (gray) are also included in one cluster. The locations of the two SusC/SusD pairs encoded within these clusters are indicated on the cladogram shown in (A) by black arrows.

