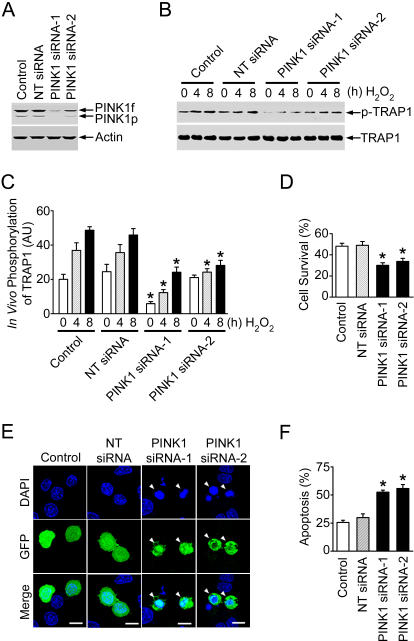
Figure 5. PINK1 Knockdown Reduces TRAP1 Phosphorylation and Protection against Oxidative Stress.
(A) PC12 cells were transfected with vehicle (control), NT siRNA, or PINK1-specific siRNAs (PINK1 siRNA-1 and PINK1 siRNA-2). The levels of PINK1 and actin in the cell lysates were analyzed by immunoblotting with anti-PINK1 and anti-actin antibodies.
(B) PC12 cells transfected with the indicated siRNA or vehicle (control) were treated with 400 μM H2O2 for the indicated times. In vivo phosphorylation of endogenous TRAP1 was determined by immunoprecipitation with anti-TRAP1 antibody followed by immunoblotting using anti-phosphoserine and anti-TRAP1 antibodies.
(C) Normalized levels of in vivo TRAP1 phosphorylation in the control and siRNA-transfected cells. Data represent mean ± SEM from three independent experiments. *Significantly different from the corresponding H2O2-treated control cells (p < 0.01). AU, arbitrary units.
(D) PC12 cells transfected with vehicle (control) or the indicated siRNAs were treated with 400 μM H2O2 for 16 h. Cell viability was assessed by using the MTT assay. Data represent mean ± SEM from three independent experiments. *Significantly different from the H2O2-treated control cells (p < 0.01).
(E) PC12 cells co-transfected with an expression vector encoding enhanced green fluorescent protein (pEGFP) and vehicle (control) or indicated siRNAs were treated with 400 μM H2O2 for 16 h. Transfected cells were shown by the green fluorescence emitted by green fluorescent protein (GFP), and nuclear morphology was visualized by DAPI staining (blue). Arrowheads indicate transfected cells with apoptotic nuclei. Scale bar, 10 μm.
(F) Apoptosis is expressed as the percentage of transfected cells with apoptotic nuclear morphology. Data represent mean ± SEM from three independent experiments. *Significantly different from the H2O2-treated control cells (p < 0.01).

