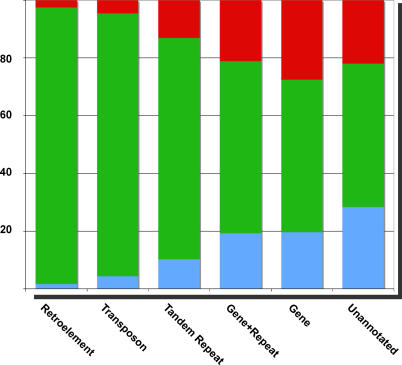
Figure 2. Variation in Methylation of Genes and Transposons.
Methylation status of tiles detecting significant methylation but not overlapping CNPs (Table 1) was compared between ecotypes. Among these were tiles annotated as retrotransposons (1,551), transposons (623), tandem repeats (107), genes with repeats (904), genes (2,174), and unannotated (304). Methylation in Col (red), both ecotypes (green), and Ler (blue) is represented in the proportional bar graphs for each class of tile. A total of 45% of genic and unannotated tiles that detected significant methylation did so in only one of the two ecotypes, while 94% of TE tiles detected significant methylation in both (Table 2).

