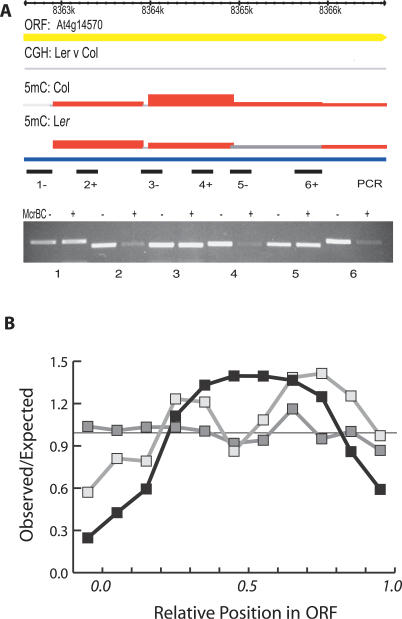
Figure 3. Methylation is Localized within Genes.
(A) Intermediate levels of methylation were detected by microarray analysis in Col and Ler for one representative gene (genome browser tracks are annotated as in Figure 1). Primer pairs 1–6 are indicated below each tile of the array. Amplification of McrBC digested Col DNA (+) and undigested Col DNA (−) was performed as in Figure 1. Failure to amplify digested DNA indicated that methylation was localized to regions 2, 4, and 6, rather than spanning the entire gene.
(B) The number of genic tiles detecting significant methylation was calculated at 10% intervals relative to the length of each gene and compared with the number expected if methylation was randomly distributed (black line). Only genes larger than 2 kb (three tiles or more per gene) were considered. Methylated tiles differing between ecotypes were also plotted in a similar way (light gray line). Genic methylation is largely concentrated in the middle of genes. For comparison, methylation distribution as a function of position was also calculated for TE-derived open reading frames (dark grey line) and is uniformly distributed.

