
Fig. 1.
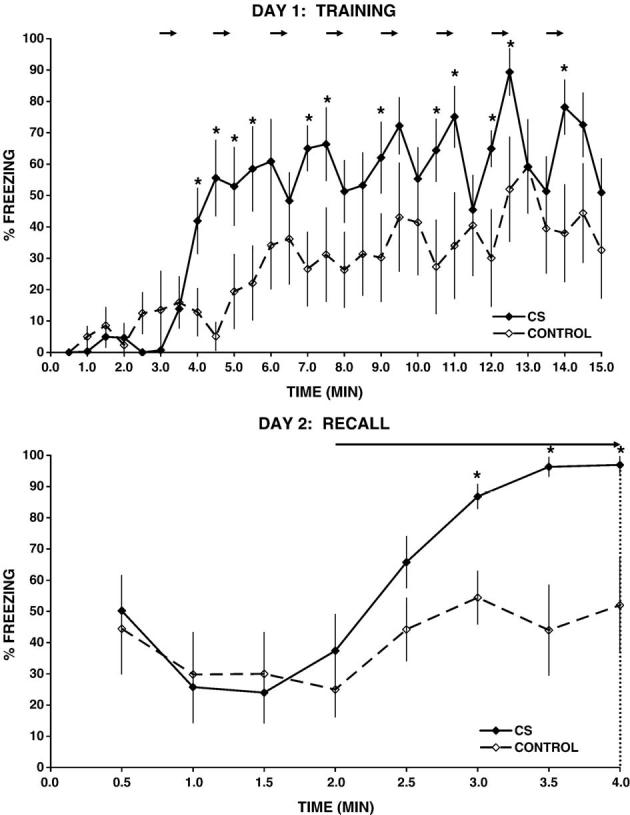
Freezing response during training (day 1) and during recall (day 2) for rats who have learned to associate a tone with an electric footshock (CS group, n = 9) or control animals (control, n = 8). Freezing scores are expressed as mean percentage of time (±SEM) spent immobile within each 30-s interval. Horizontal arrows on day 1 correspond to delivery of a tone stimulus (30-s duration) followed by delivery of a 1-s, 1-mA footshock (CS) or no footshock (control). On day 2, following a 2-min baseline, all animals were exposed to a 2-min continuous tone exposure (horizontal arrow), followed thereafter by triggering of the pump to inject the radiotracer (indicated by the vertical dotted line). *P < 0.05 for t test performed separately for each 30-s time interval.