
Fig. 11.
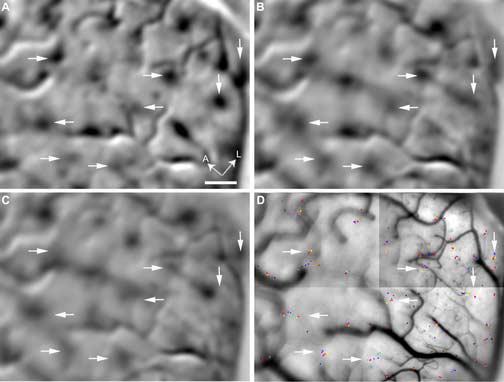
Co-localization of color patches and peak clusters. (A) A differential image that compares the response to red/green gratings with that to black/white gratings. The arrows point to some color patches that preferentially responded to chromatic gratings. (B)-(C) Single-condition images associated with uniform red and blue, respectively. (D) Peak locations marked on an anatomical image of the surface. The peak clusters pointed by the arrows correspond to those shown in Fig. 6E-L. The location of the arrows is fixed across different panels. A, anterior; L, lateral; Scale bar: 500 μm.