
Fig. 4.
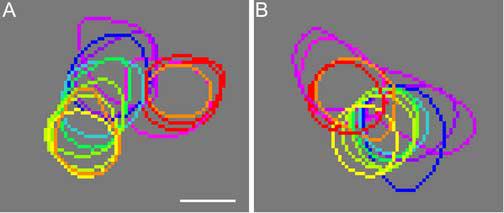
Contours of the peak response regions activated by different colors. (A) The contours derived from the region in the upper-right frame in Fig. 2. (B) The contours derived from the region in the lower-left frame in Fig. 2. The color of each contour corresponds to the color of the associated stimulus. Scale bar: 100 μm.