
Fig. 1.
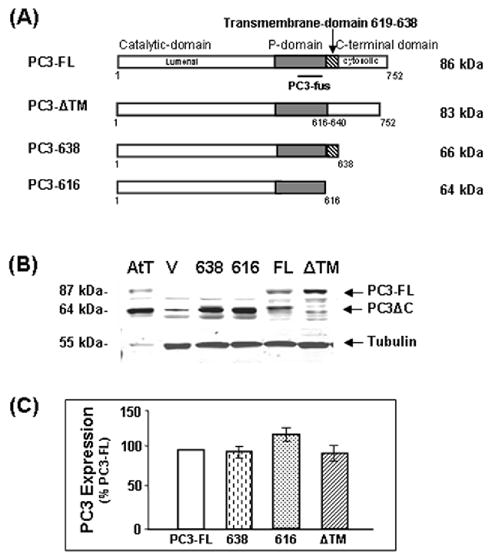
Analysis of PC3 expression in transfected Neuro2A cells. (A) Schematic representation of the PC3 constructs: PC3-FL, full length PC3; PC3-ΔTM, PC3 without the transmembrane domain; PC3-638, C-terminally truncated PC3 with the transmembrane domain; PC3-616, C-terminally truncated PC3 without the transmembrane domain. (B) Western blot of PC3 expression in AtT-20 cell lysate (AtT) as a positive control (5 μg), cell lysates (30 μg) of Neuro-2A cells transfected with vector only (V), PC3-638 (638), PC3-616 (616), full-length PC3 (FL), or PC3-ΔTM (−ΔTM). (C) Quantification of expression levels of intracellular PC3 in the cells transfected with truncated PC3 enzymes relative to PC3-FL (open bar) designated as 100%, after normalizing to expression levels of endogenous protein, tubulin (55 kDa), (mean ±SEM, n=4). There was no significant difference between the four constructs as assessed by the Student t test.