
Fig. 6.
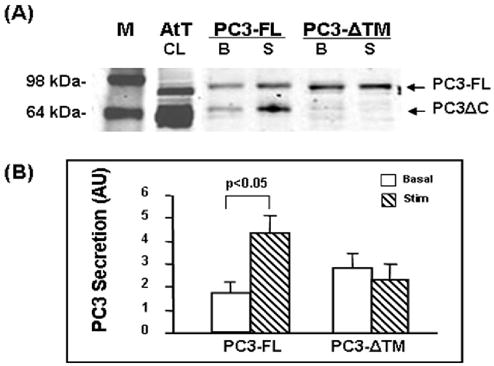
Analysis of PC3-ΔTM secretion in transfected Neuro2A cells.
(A) Representative Western blot showing PC3 secretion levels from concentrated medium. M: molecular weight marker; AtT20 cell lysate (AtT, CL, 5 μg); 20 μl of basal medium (B) and stimulated medium (S) from PC3-FL (FL) or PC3-ΔTM (ΔTM) transfected N2A cells.
(B) Quantification of PC3 secretion levels expressed as mean ±SEM from stimulated medium (hashed bars) versus basal medium (open bars) from Western blots from four separate experiments (AU: arbitrary units).