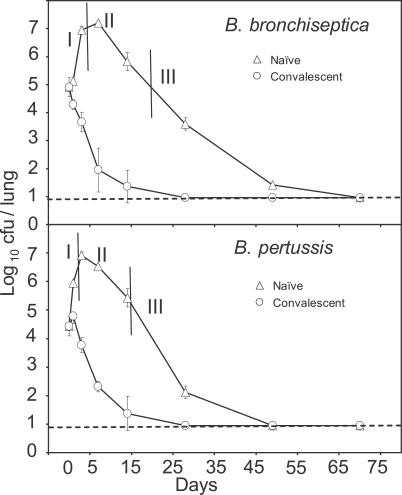
Figure 6. Growth Curves of the Bacteria in Naive and Convalescent Mice Indicating Three Phases of Pathogenesis.
Open triangles represent the experimentally observed mean ± standard error of bacterial number time courses of B. bronchiseptica (top) and B. pertussis (bottom) infection in naive mice. Vertical lines delineate the three pathogenesis phases, which we identify as phase I: innate immune responses (0–7 d); phase II: activation of Th2-related responses and inhibition of Th1-related responses (8–21 d); and phase III: commencement of Th1-related responses and clearance (22–70 d). Open circles represent mean ± standard error of bacterial numbers in a secondary challenge, by the same species, of convalescent mice on day 49 postinoculation with B. bronchiseptica (top) and B. pertussis (bottom). For each case, four mice from each group were killed on the indicated days, and bacterial burden in the lungs was determined. The dotted line denotes the experimental detection limit.

