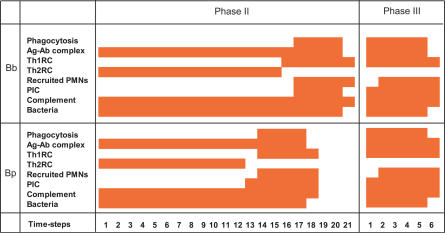
Figure 8. The Pattern of Activation of Key Nodes during Secondary Infections.
Time course patterns of key nodes (y-axis) plotted against time steps (x-axis) during secondary infection by B. bronchiseptica (Bb) and B. pertussis (Bp). One time step corresponds to 1 d to 2 d. The initial state corresponds to the activity of immune system components at the start of the secondary infection. Two scenarios are shown: secondary infection given in phase II of the primary infection (third column), or in phase III of the primary infection (fourth column).

