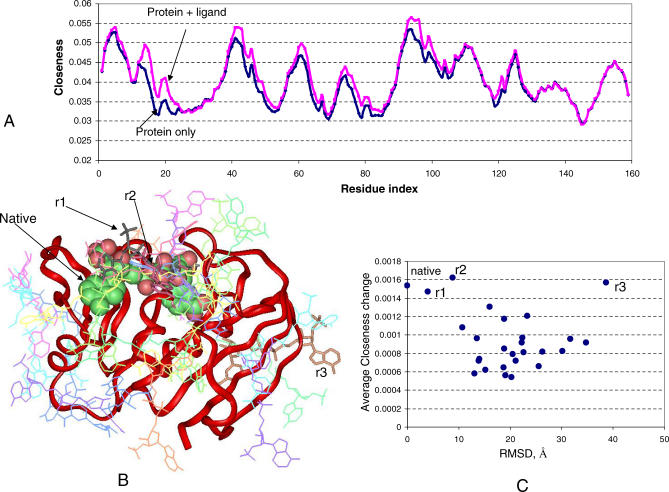
Figure 4. Network-Bridging Effect of Ligand Binding.
(A) Comparison of the closeness of native DHFR with and without cofactor binding. The blue line is the plot of the closeness of the apo form of DHFR, and the pink line is the closeness for the DHFR–cofactor complex.
(B) Clusters of docking solutions from patch-docking. The native cofactor is represented as colored spheres, and r1 and r2 are also located in the native binding site, but with different orientation. r3 is away from the binding site. Other docking solutions scattered around the DHFR surface in different regions.
(C) Average closeness change compared with DHFR after ligand binding into various surface patches; see Figure 3A.

