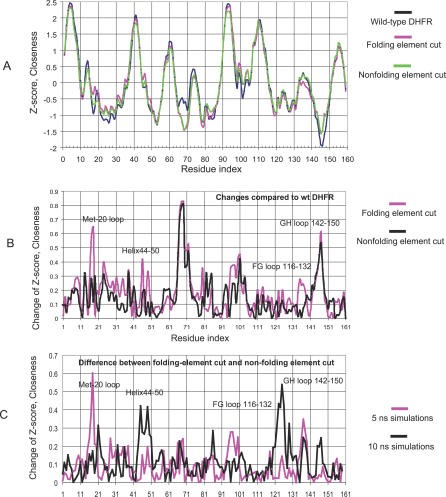
Figure 6. The Change of Closeness for MD Average Structures for Folding and Nonfolding Groups.
(A) z-Score of closeness for MD average wild-type DHFR structure (blue), averaged z-scores for the folding elements cutting group (pink), and averaged z-scores for the nonfolding elements cutting group (green).
(B) The changes of the z-scores of the two cutting groups compared with the z-score of closeness for the MD average wild-type DHFR structure.
(C) The differences of the z-scores of the folding element cutting group (a01, a02, a08, a08, and a10) and nonfolding element variants (b01, b04, b05, b08, and b09) averaged from 5-ns MD simulations and 10-ns simulations. The dynamics effects are in the functional loop regions.

