
Figure 3.
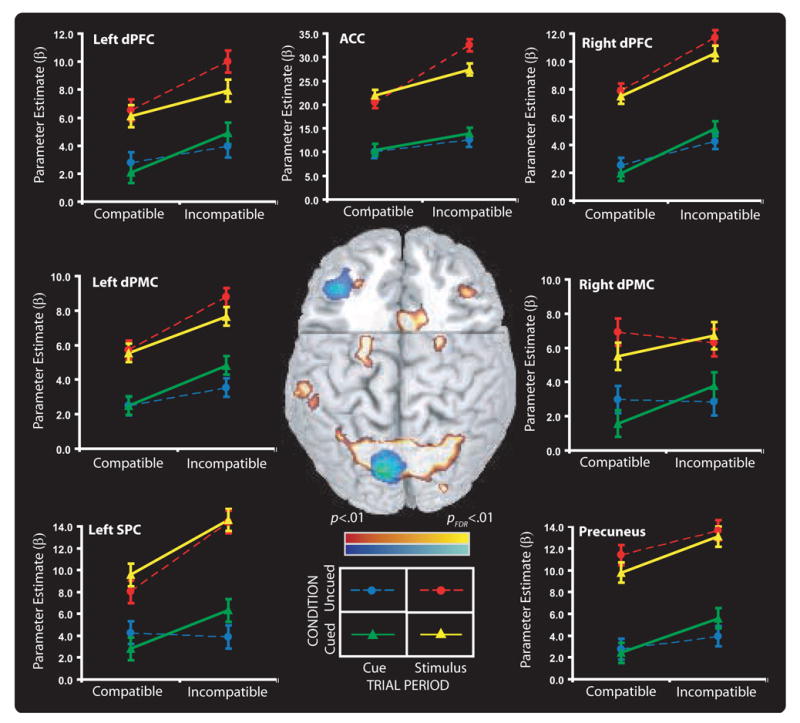
Extent of activity for cortical regions from the Table superimposed on a spatial normalized brain, with frontal section removed at (y = 10, z = 26). Voxels with incompatible vs. compatible task related activity greater than p<.01 (uncorrected) contiguous to peak activity are shown. Regions showing a compatibility effect during the cue period are shown in cool colors and regions showing a compatibility effect active during the stimulus period are shown in warm colors. The line graphs plot mean activity and standard errors relative to baseline for each task during both trial periods when cued or uncued for the regions-of-interest from left dPFC and from Schumacher et al. (2003) and MacDonald et al. (2000).