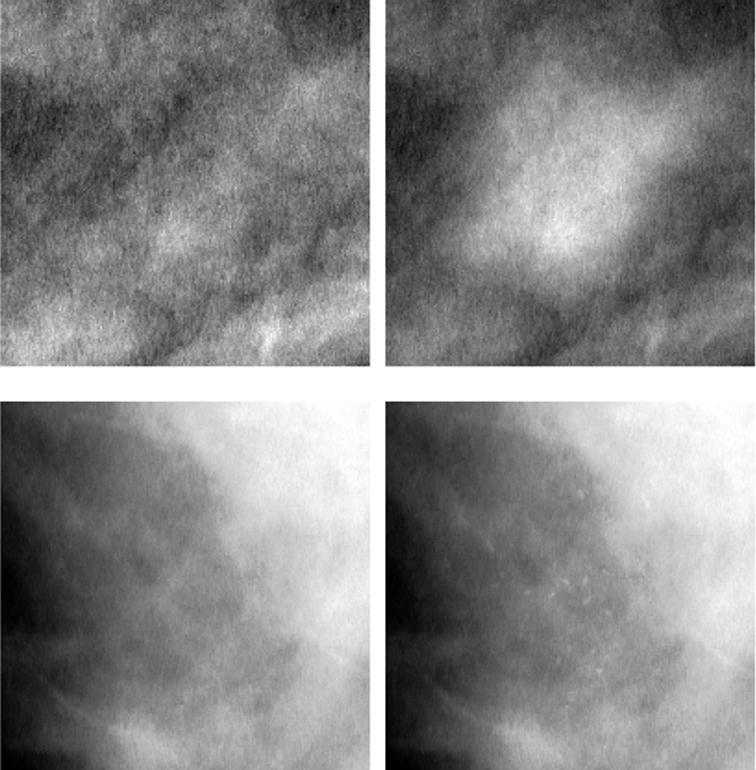
Figure 3.

Appearance of lesions inserted into mammographic regions of interest (optimally windowed unprocessed images). The top row, left and right, consists of an image detail with and without a mass inserted, respectively (mass ‘e’ from Figure 1). The bottom row, left and right, consists of an image region with and without a microcalcification cluster inserted, respectively (microcalcification ‘a’ from Figure 2).
