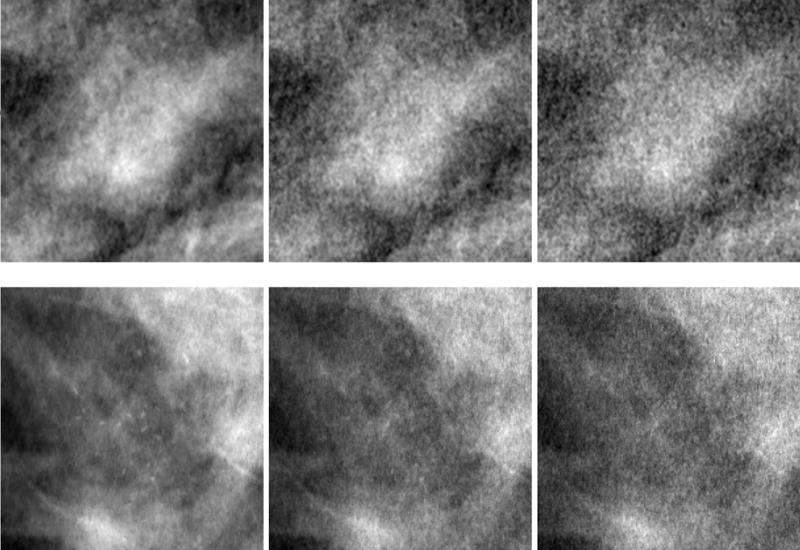
Figure 4.

Display-processed regions of interest from two images (top and bottom rows) showing inserted lesions at the three dose levels used in the study. The top row (from left to right) consists of the same mass as in Figure 3 at dose levels 100%, 50% and 30%, respectively. The bottom row (from left to right) consists of the same microcalcification cluster as in Figure 3 at dose levels 100%, 50%, and 30%, respectively. Note the visible increase in noise as the dose is reduced from 100% to 30%.
