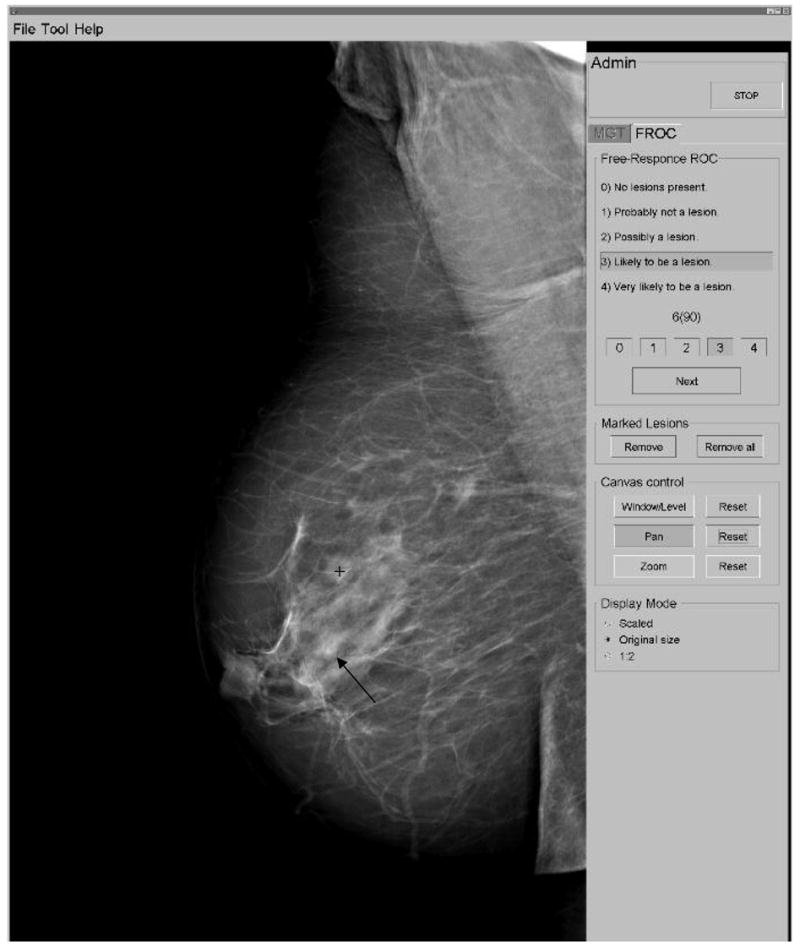
Figure 5.

Graphical user interface used in the human observer studies. In this example, there were two masses present in the image: the observer has marked an actual region (mass ‘b’ from Figure 1) with a ‘+’ and ranked it as a ‘3’, i.e. ‘likely to be a lesion’. The second mass in the image, mass ‘e’ from Figure 1, was not marked (actual location indicated with the arrow).
