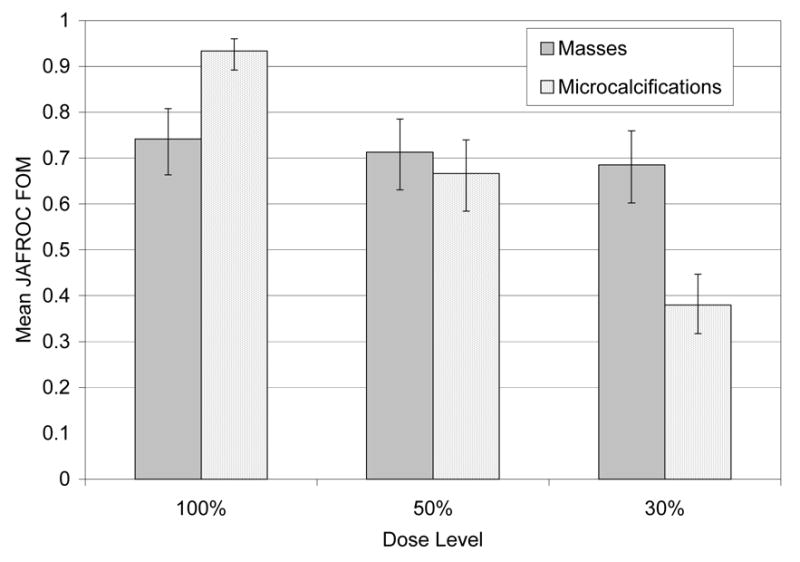
Figure 6.

The reader-averaged free-response figure of merit (FOM) at each dose level for masses (gray) and microcalcifications (dotted). Note the steep decline for the microcalcifications as a function of dose and the relative constancy for the masses. The uncertainty bars represent 95% confidence intervals. The microcalcification FOM decline was statistically significant; that for masses was not
